

ISSN 1004-5759 CN 62-1105/S
草业学报 ›› 2026, Vol. 35 ›› Issue (5): 20-35.DOI: 10.11686/cyxb2025209
刘雪霞( ), 郝媛媛(), 孟哲, 安春春, 何生申, 黄才成, 祁瀚, 花立民, 楚彬
收稿日期:2025-05-26
修回日期:2025-07-18
出版日期:2026-05-20
发布日期:2026-03-11
通讯作者:
郝媛媛
作者简介:Corresponding author. E-mail: haoyy@gsau.edu.cn基金资助:
Xue-xia LIU(), Yuan-yuan HAO(), Zhe MENG, Chun-chun AN, Sheng-shen HE, Cai-cheng HUANG, Han QI, Li-min HUA, Bin CHU
Received:2025-05-26
Revised:2025-07-18
Online:2026-05-20
Published:2026-03-11
Contact:
Yuan-yuan HAO
摘要:
为深入揭示高寒山地生态系统土地利用/覆被变化的时空演变特征及其驱动机制,本研究以祁连山国家公园为研究区,基于多期遥感数据构建恒定、涨势与落势图谱,系统分析1990-2022年土地利用/覆被变化(LUCC)的演变过程及其驱动因子。结果表明:1)土地利用/覆被变化图谱能够有效反映典型时间节点(1995、1997、2004、2008和2019年)与区域生态工程的高度一致性。2)土地利用/覆被变化图谱可以深入刻画土地利用/覆被各时段的细节差异。具体地,从恒定图谱来看,草原(>48.00%)和裸地(>25.00%)主要呈块状分布于大雪山峰与则吾结山峰区域;从涨势图谱来看,草原扩张主要集中在大雪山峰和冷龙岭山峰区域,而裸地扩张区域则主要集中在祁连山峰和大雪山峰,且扩张幅度裸地低于草原(整体低2.75%),森林、冰雪和水域等类型扩张幅度均较小(<3.00%);从落势图谱来看,草原(>1.40%)和裸地(≥1.09%)的收缩面积明显高于其他类型(>0.01%),且收缩区域除以块状分布于祁连山峰与冷龙岭山峰之间外,还零星分布于整个祁连山脉。3)土地利用/覆被变化图谱可以表征土地利用程度呈东南高、西北低的分布趋势,且主要受潜在蒸散发量、海拔和人类足迹等自然因子的影响(>0.09),同时经济发展和政策干预的影响作用逐渐显现。本研究展示了一种基于变化图谱的LUCC动态识别新路径,不仅能够区分其稳定区与变化区,还能量化其动态变化,提升了土地系统动态表达的精度与深度。研究结果可为高寒山地生态系统管理提供科学参考与决策支持。
刘雪霞, 郝媛媛, 孟哲, 安春春, 何生申, 黄才成, 祁瀚, 花立民, 楚彬. 基于变化图谱视角下的高寒山地生态系统土地利用模式及驱动因素探究[J]. 草业学报, 2026, 35(5): 20-35.
Xue-xia LIU, Yuan-yuan HAO, Zhe MENG, Chun-chun AN, Sheng-shen HE, Cai-cheng HUANG, Han QI, Li-min HUA, Bin CHU. Exploring land use patterns and their driving forces in alpine mountain ecosystems: A changing atlas perspective[J]. Acta Prataculturae Sinica, 2026, 35(5): 20-35.
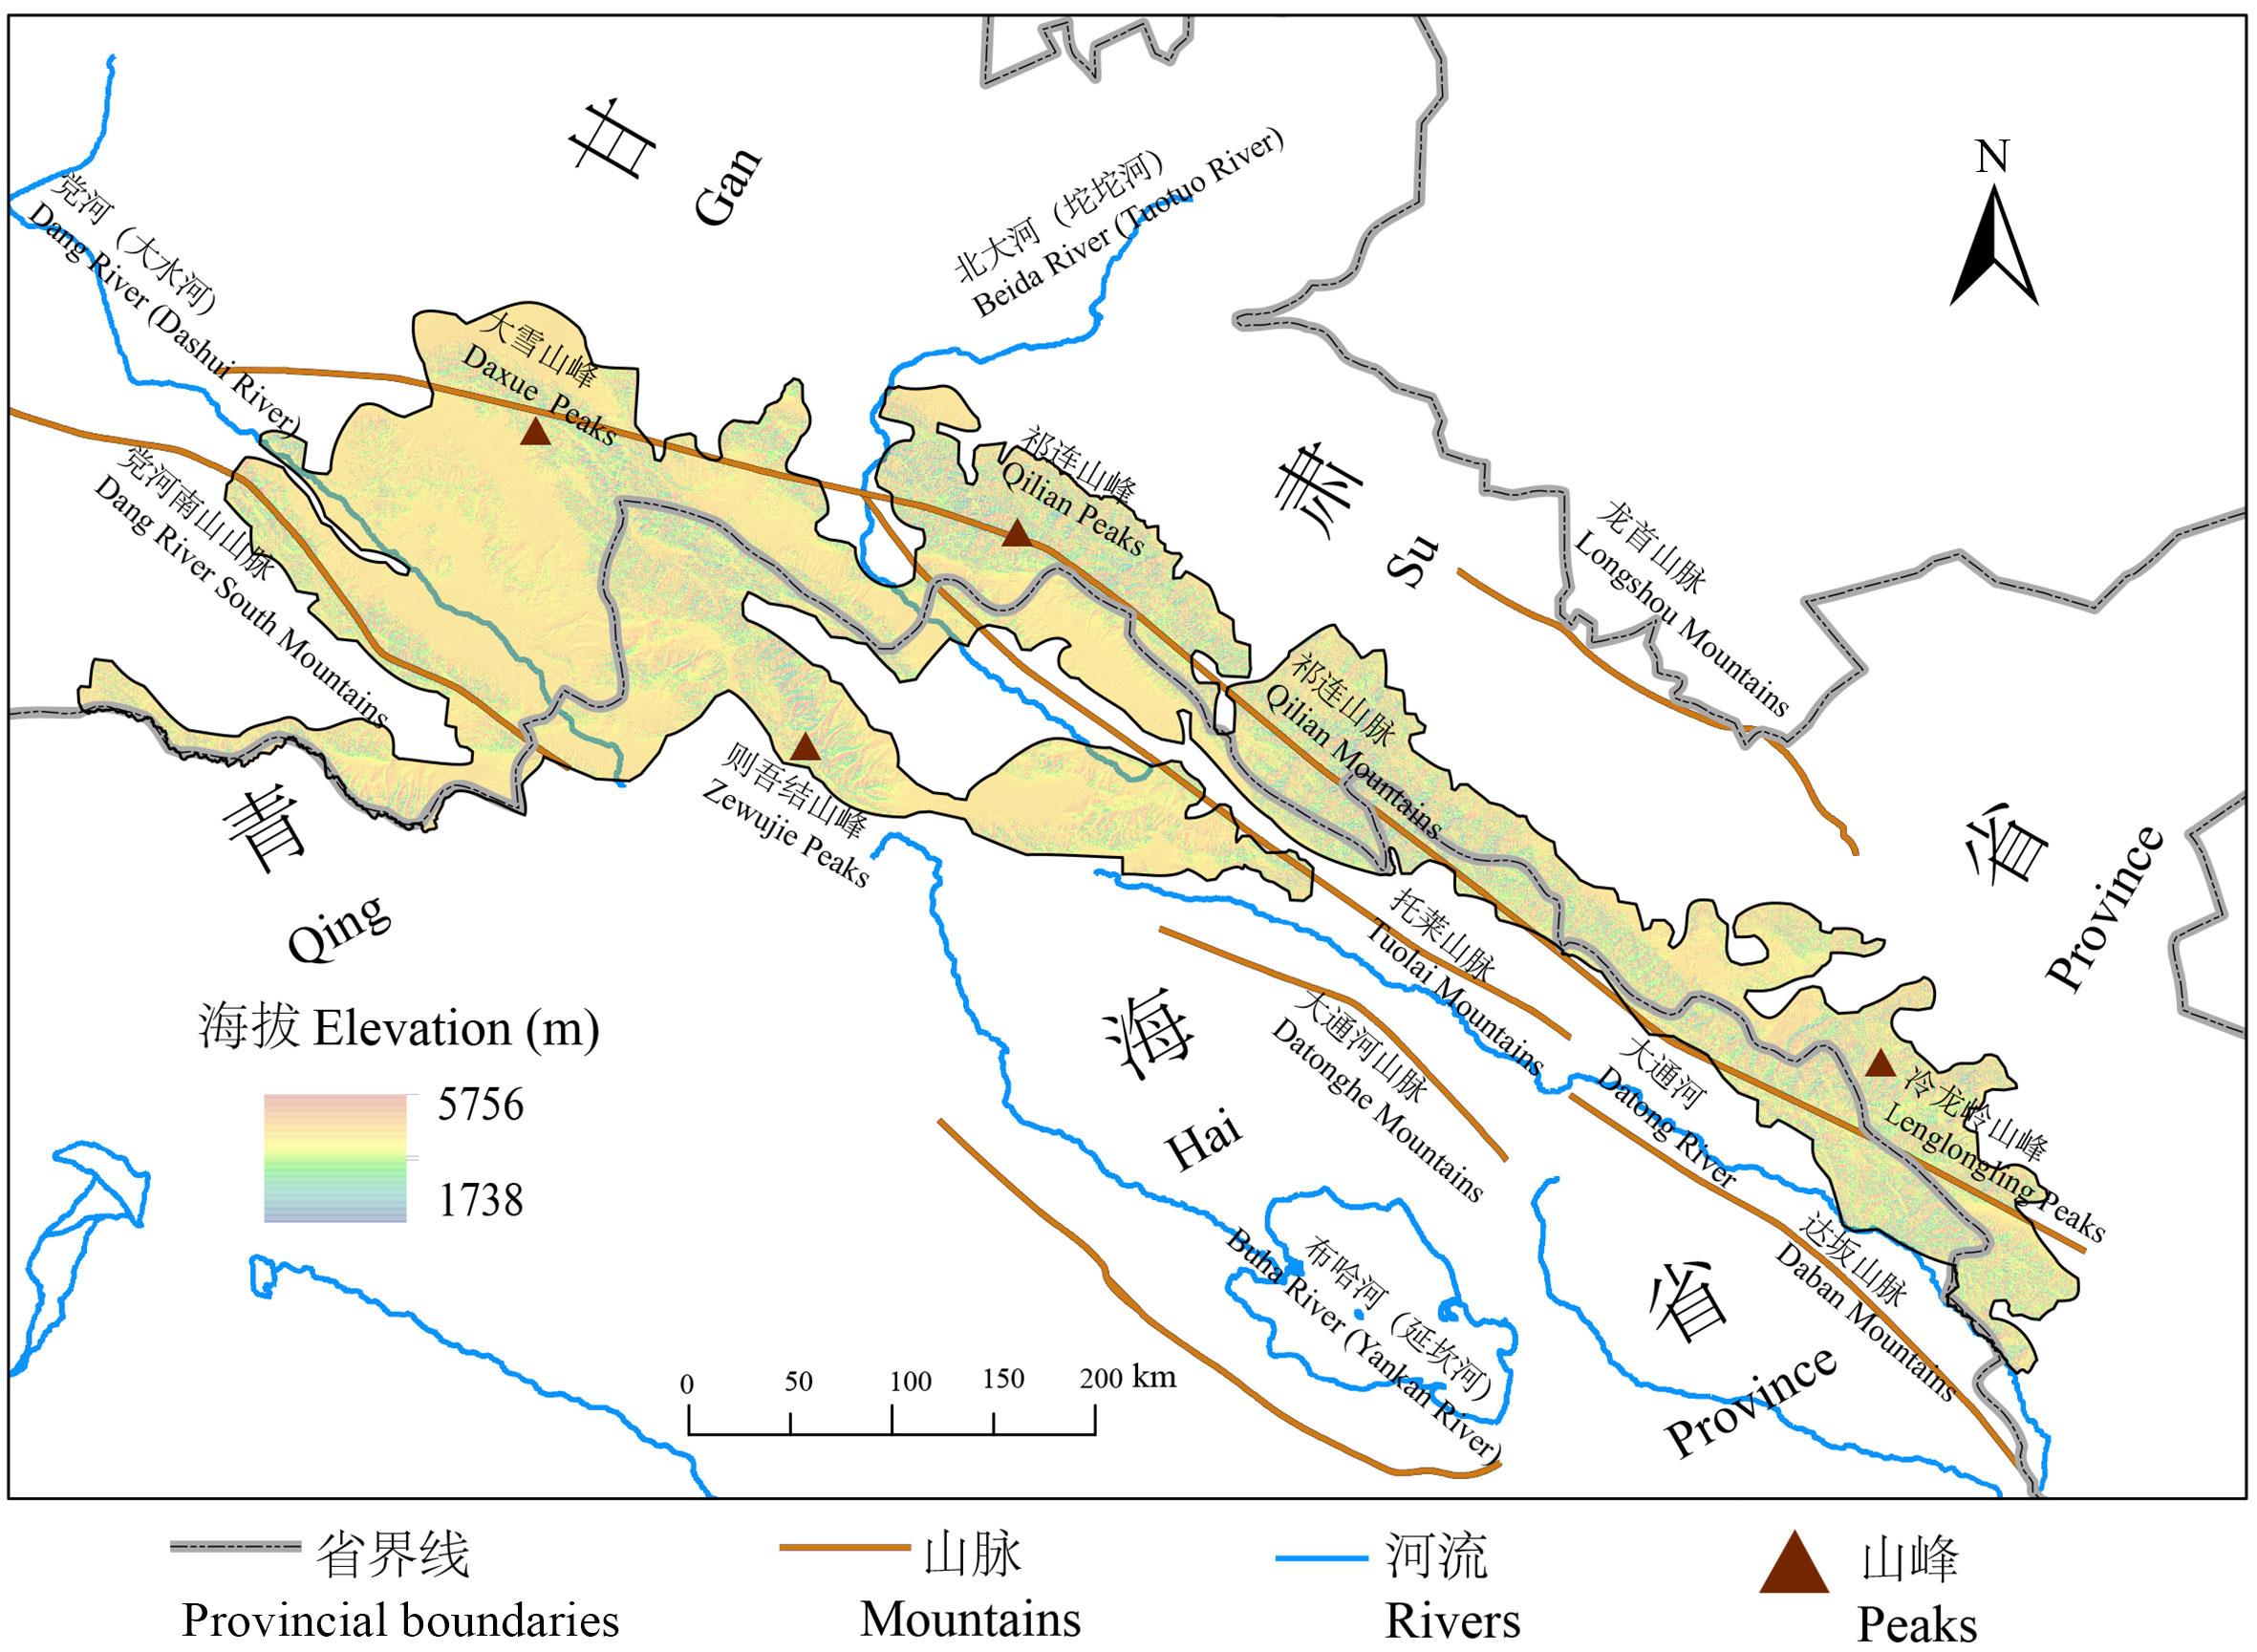
图1 研究区位置基于自然资源部标准地图服务网GS(2020)4619号标准地图制作,底图边界无修改。Based on the standard map GS(2020)4619 from the Standard Map Service of the Ministry of Natural Resources, with no modification to the base map boundaries.
Fig.1 Location of the study area
数据类型 Data type | 数据名称 Data name | 数据来源 Data source | 分辨率 Resolution | 格式 Format |
|---|---|---|---|---|
| 气候Climate | 降水量、气温和潜在蒸散发量Precipitation, temperature, and potential evapotranspiration | 国家地球系统科学数据中心共享服务平台National earth system science data center shared service platform(http://www.geodata.cn) | 1 km | 数字控制Numerical control(NC) |
| 土地利用/覆被Land use/cover | 土地利用/覆被变化Land use/cover change (LUCC) | 中国科学院资源环境科学与数据中心Resource and environmental science and data center, Chinese Academy of Sciences (https://www.resdc.cn) | 1 km | 标记图像文件格式Tagged image file format (TIF) |
| 土壤Soil | 黏土、砂粒和细粉粒含量Clay, sand, and silt content | 世界土壤数据库Harmonized world soil database (HWSD,https://poles.tpdc.ac.cn) | 1 km | 标记图像文件格式Tagged image file format (TIF) |
| 地形Topography | 数字高程模型、坡度和坡向Digital elevation model (DEM), slope, and aspect | 中国科学院地理空间数据云平台Chinese Academy of Sciences, geospatial data cloud platform (https://www.gscloud.cn) | 30 m | 标记图像文件格式Tagged image file format (TIF) |
| 人类社会经济Human socio-economy | 国内生产总值Gross domestic product(GDP) | 中国科学院资源环境科学与数据中心Resource and environmental science and data center, Chinese Academy of Sciences (https://www.resdc.cn) | 1 km | 标记图像文件格式Tagged image file format (TIF) |
| 人类足迹指数Human footprint index | 中国农业大学土地科学与技术学院College of Land Science and Technology, China Agricultural University (https://www.x-mol.com) | 1 km | 数字控制Numerical control (NC) | |
| 人口密度Population density | 人口密度数据库Population density database (https://landscan.ornl.gov/) | 1 km | 标记图像文件格式Tagged image file format (TIF) | |
| 林业工程、化肥使用量和粮食总产量Forestry engineering, fertilizer usage, and total grain production | 2000-2022年中国统计年鉴2000-2022 China statistical yearbook (https://www.stats.gov.cn/sj/ndsj/) | 无None | 文本Text | |
| 综合因子Integrated factors | 水土流失和受灾面积Soil erosion and disaster-affected area | 2000-2022年中国统计年鉴2000-2022 China statistical yearbook (https://www.stats.gov.cn/sj/ndsj/) | 无None | 文本Text |
表1 数据来源及详细信息
Table 1 Data sources and detailed information
数据类型 Data type | 数据名称 Data name | 数据来源 Data source | 分辨率 Resolution | 格式 Format |
|---|---|---|---|---|
| 气候Climate | 降水量、气温和潜在蒸散发量Precipitation, temperature, and potential evapotranspiration | 国家地球系统科学数据中心共享服务平台National earth system science data center shared service platform(http://www.geodata.cn) | 1 km | 数字控制Numerical control(NC) |
| 土地利用/覆被Land use/cover | 土地利用/覆被变化Land use/cover change (LUCC) | 中国科学院资源环境科学与数据中心Resource and environmental science and data center, Chinese Academy of Sciences (https://www.resdc.cn) | 1 km | 标记图像文件格式Tagged image file format (TIF) |
| 土壤Soil | 黏土、砂粒和细粉粒含量Clay, sand, and silt content | 世界土壤数据库Harmonized world soil database (HWSD,https://poles.tpdc.ac.cn) | 1 km | 标记图像文件格式Tagged image file format (TIF) |
| 地形Topography | 数字高程模型、坡度和坡向Digital elevation model (DEM), slope, and aspect | 中国科学院地理空间数据云平台Chinese Academy of Sciences, geospatial data cloud platform (https://www.gscloud.cn) | 30 m | 标记图像文件格式Tagged image file format (TIF) |
| 人类社会经济Human socio-economy | 国内生产总值Gross domestic product(GDP) | 中国科学院资源环境科学与数据中心Resource and environmental science and data center, Chinese Academy of Sciences (https://www.resdc.cn) | 1 km | 标记图像文件格式Tagged image file format (TIF) |
| 人类足迹指数Human footprint index | 中国农业大学土地科学与技术学院College of Land Science and Technology, China Agricultural University (https://www.x-mol.com) | 1 km | 数字控制Numerical control (NC) | |
| 人口密度Population density | 人口密度数据库Population density database (https://landscan.ornl.gov/) | 1 km | 标记图像文件格式Tagged image file format (TIF) | |
| 林业工程、化肥使用量和粮食总产量Forestry engineering, fertilizer usage, and total grain production | 2000-2022年中国统计年鉴2000-2022 China statistical yearbook (https://www.stats.gov.cn/sj/ndsj/) | 无None | 文本Text | |
| 综合因子Integrated factors | 水土流失和受灾面积Soil erosion and disaster-affected area | 2000-2022年中国统计年鉴2000-2022 China statistical yearbook (https://www.stats.gov.cn/sj/ndsj/) | 无None | 文本Text |
土地利用类型 Land use type | Mann-Kendall (M-K)趋势检验Trend test | 突变检测Breakpoint test | ||
|---|---|---|---|---|
统计学Z值 Statistical Z-value | 趋势 Trend (α=0.05) | M-K突变点检测 M-K breakpoint test (α=0.05) | 滑动t检验 Sliding t-test (α=0.05) | |
| 农田Cropland | 0.48 | 不显著Not significant ↑ | 1999、2007、2002 | 1994、1997、1999、2011、2015、2019 |
| 森林Forest | 7.79 | 显著Significant ↑ | 无None | 1993、1995、1997、2005、2008、2012、2015 |
| 灌木Shrub | -3.08 | 显著Significant ↓ | 2004 | 1994、1997、2002、2004、2006、2008、2011、2013 |
| 草原Grassland | 5.07 | 显著Significant ↑ | 2006 | 1995、1997、2008、2013、2019 |
| 水域Water | 1.50 | 不显著Not significant ↑ | 1991 | 1998、2000、2003、2008、2006、2010、2012、2015、2017、2019 |
| 冰雪Snow | 0.29 | 不显著Not significant ↑ | 1990、1996 | 1992、1995、2000、2004、2012、2014、2017、2019 |
| 裸地Bare land | -5.10 | 显著Significant ↓ | 2004 | 1995、1997、2000、2008、2019 |
表2 1990-2022年不同土地利用类型的变化趋势及突变年份
Table 2 Trends and abrupt change years of various land use types from 1990 to 2022
土地利用类型 Land use type | Mann-Kendall (M-K)趋势检验Trend test | 突变检测Breakpoint test | ||
|---|---|---|---|---|
统计学Z值 Statistical Z-value | 趋势 Trend (α=0.05) | M-K突变点检测 M-K breakpoint test (α=0.05) | 滑动t检验 Sliding t-test (α=0.05) | |
| 农田Cropland | 0.48 | 不显著Not significant ↑ | 1999、2007、2002 | 1994、1997、1999、2011、2015、2019 |
| 森林Forest | 7.79 | 显著Significant ↑ | 无None | 1993、1995、1997、2005、2008、2012、2015 |
| 灌木Shrub | -3.08 | 显著Significant ↓ | 2004 | 1994、1997、2002、2004、2006、2008、2011、2013 |
| 草原Grassland | 5.07 | 显著Significant ↑ | 2006 | 1995、1997、2008、2013、2019 |
| 水域Water | 1.50 | 不显著Not significant ↑ | 1991 | 1998、2000、2003、2008、2006、2010、2012、2015、2017、2019 |
| 冰雪Snow | 0.29 | 不显著Not significant ↑ | 1990、1996 | 1992、1995、2000、2004、2012、2014、2017、2019 |
| 裸地Bare land | -5.10 | 显著Significant ↓ | 2004 | 1995、1997、2000、2008、2019 |
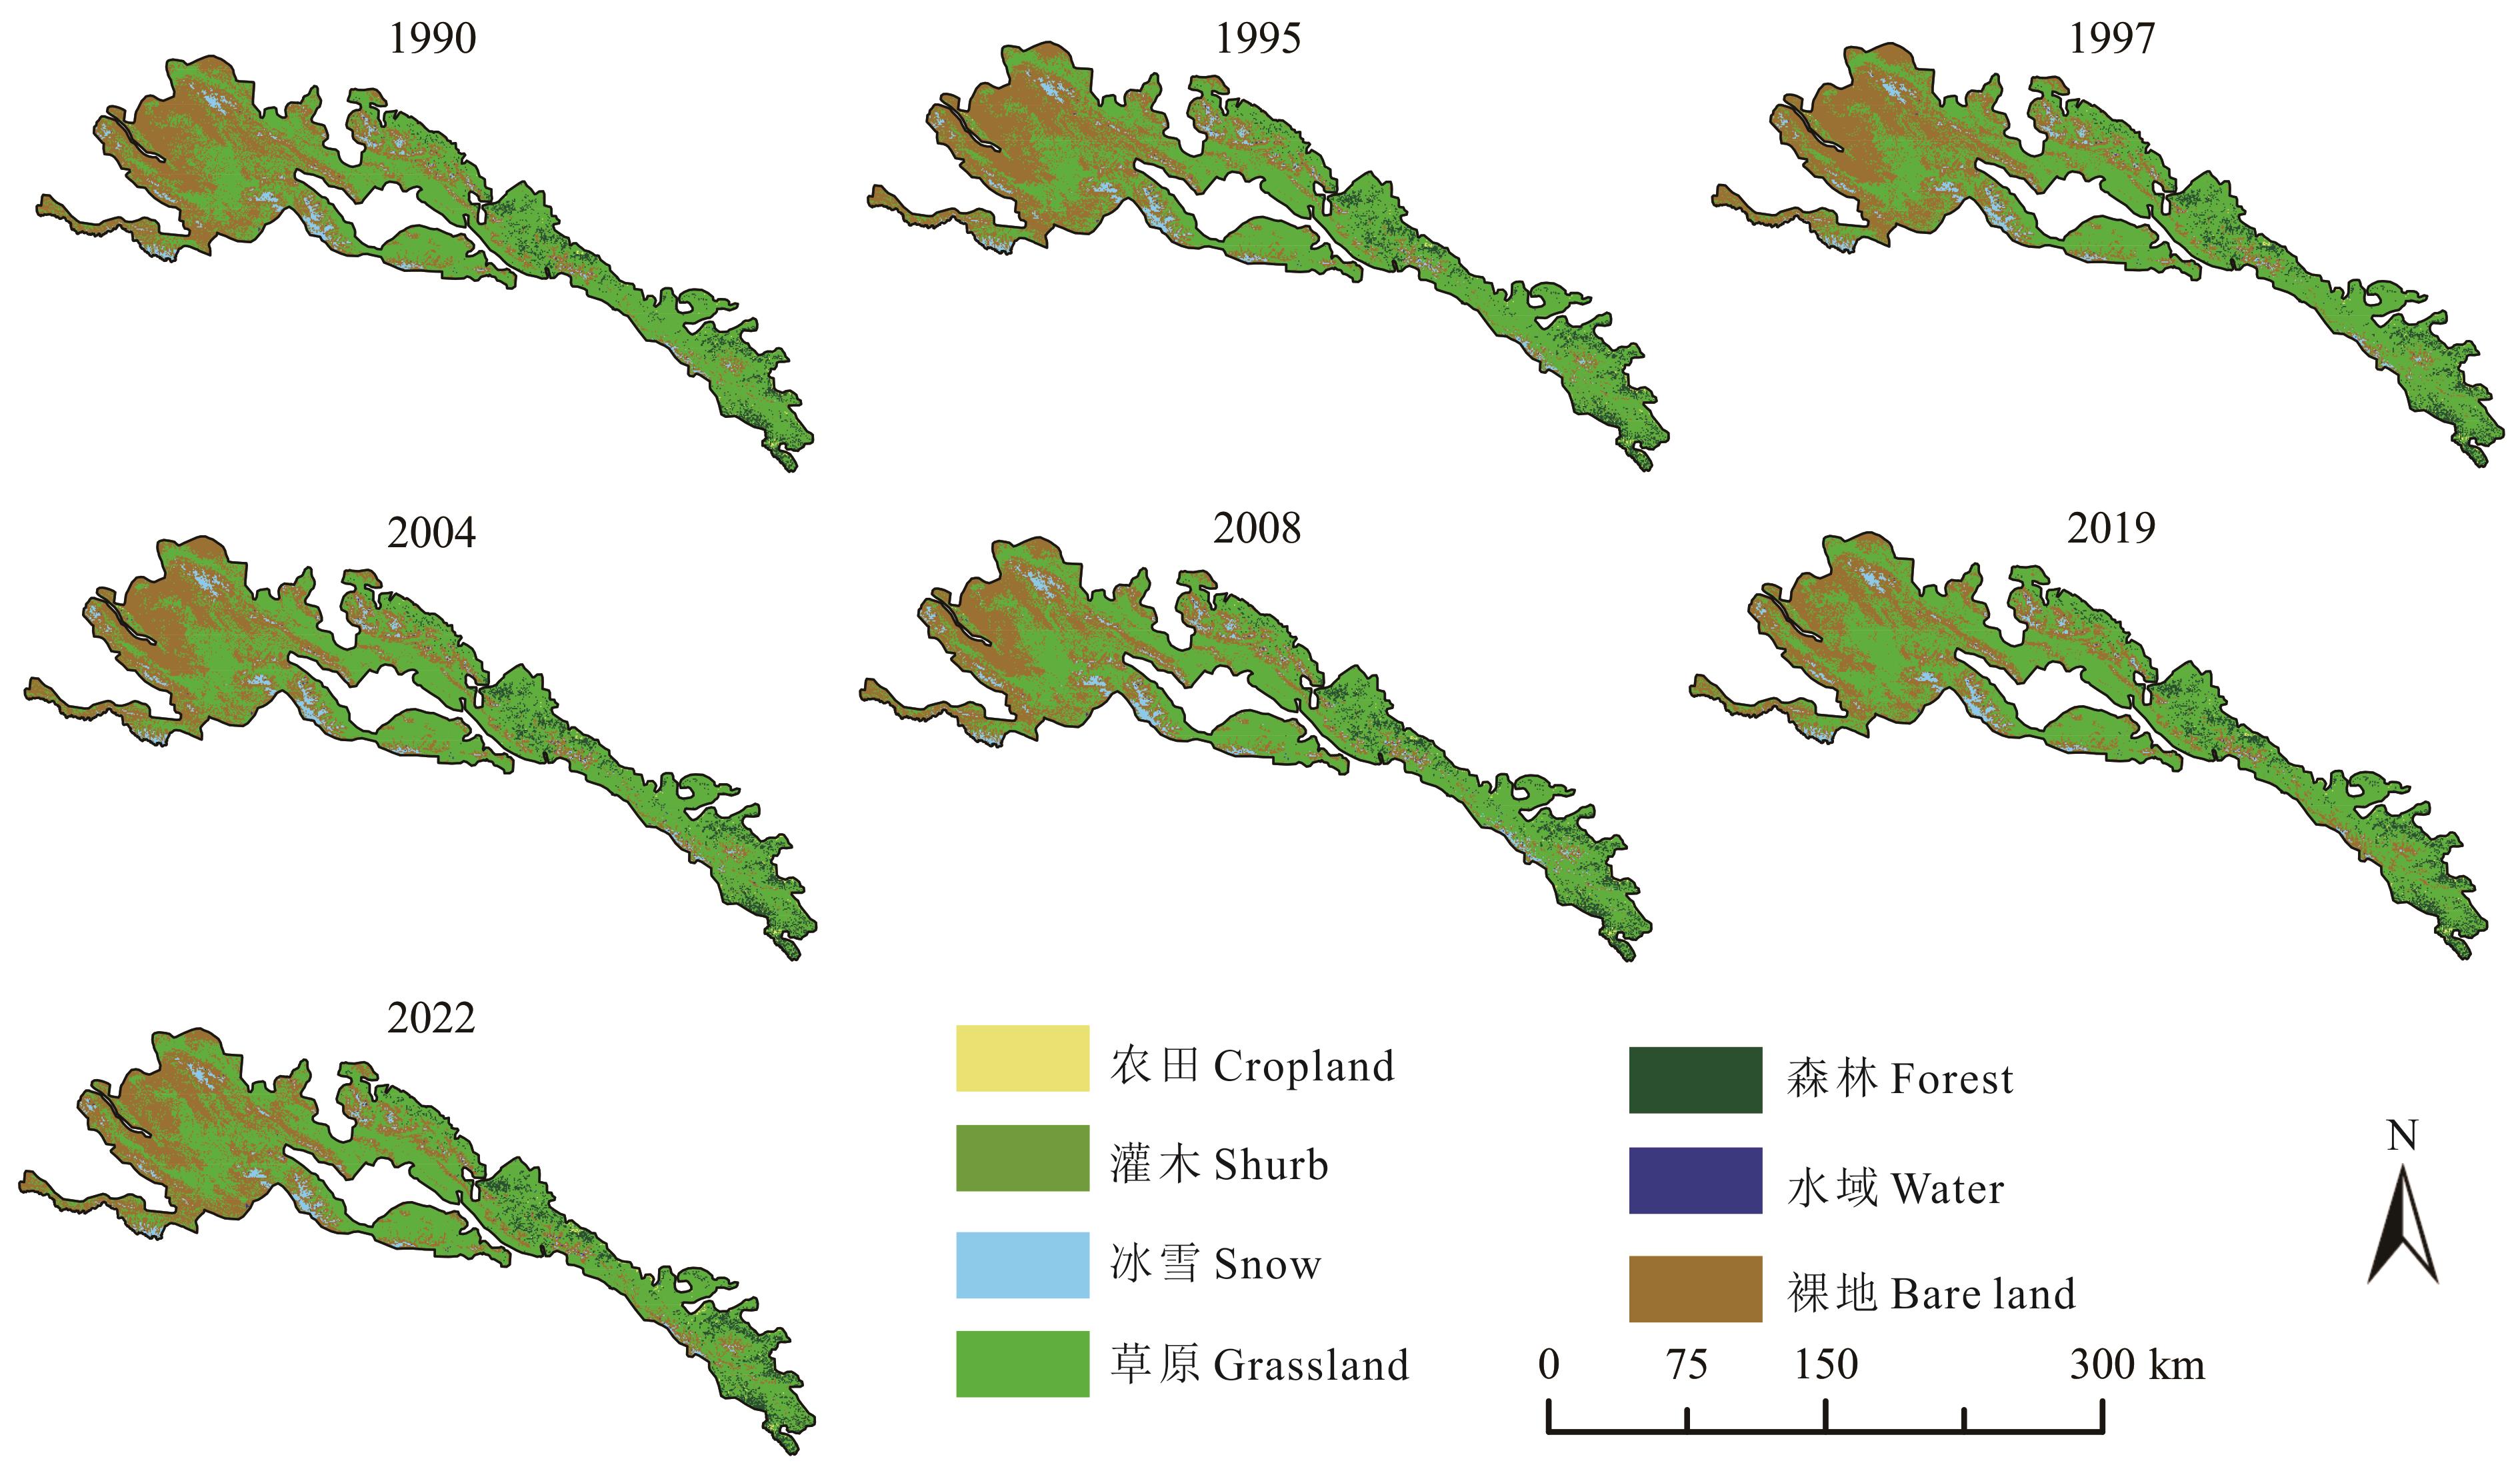
图2 典型年份的土地利用空间分布基于自然资源部标准地图服务网GS(2020)4619号标准地图制作,底图边界无修改。Based on the standard map GS(2020)4619 from the Standard Map Service of the Ministry of Natural Resources, with no modification to the base map boundaries.
Fig. 2 Spatial distribution of land use in typical years

图3 不同时段的恒定图谱基于自然资源部标准地图服务网GS(2020)4619号标准地图制作,底图边界无修改。Based on the standard map GS(2020)4619 from the Standard Map Service of the Ministry of Natural Resources, with no modification to the base map boundaries.
Fig.3 Constant maps for different periods

图4 不同时段的涨势图谱基于自然资源部标准地图服务网GS(2020)4619号标准地图制作,底图边界无修改。Based on the standard map GS(2020)4619 from the Standard Map Service of the Ministry of Natural Resources, with no modification to the base map boundaries.
Fig.4 Growth trend maps for different periods

图5 不同时段的落势图谱基于自然资源部标准地图服务网GS(2020)4619号标准地图制作,底图边界无修改。Based on the standard map GS(2020)4619 from the Standard Map Service of the Ministry of Natural Resources, with no modification to the base map boundaries.
Fig.5 Decline trend maps for different periods
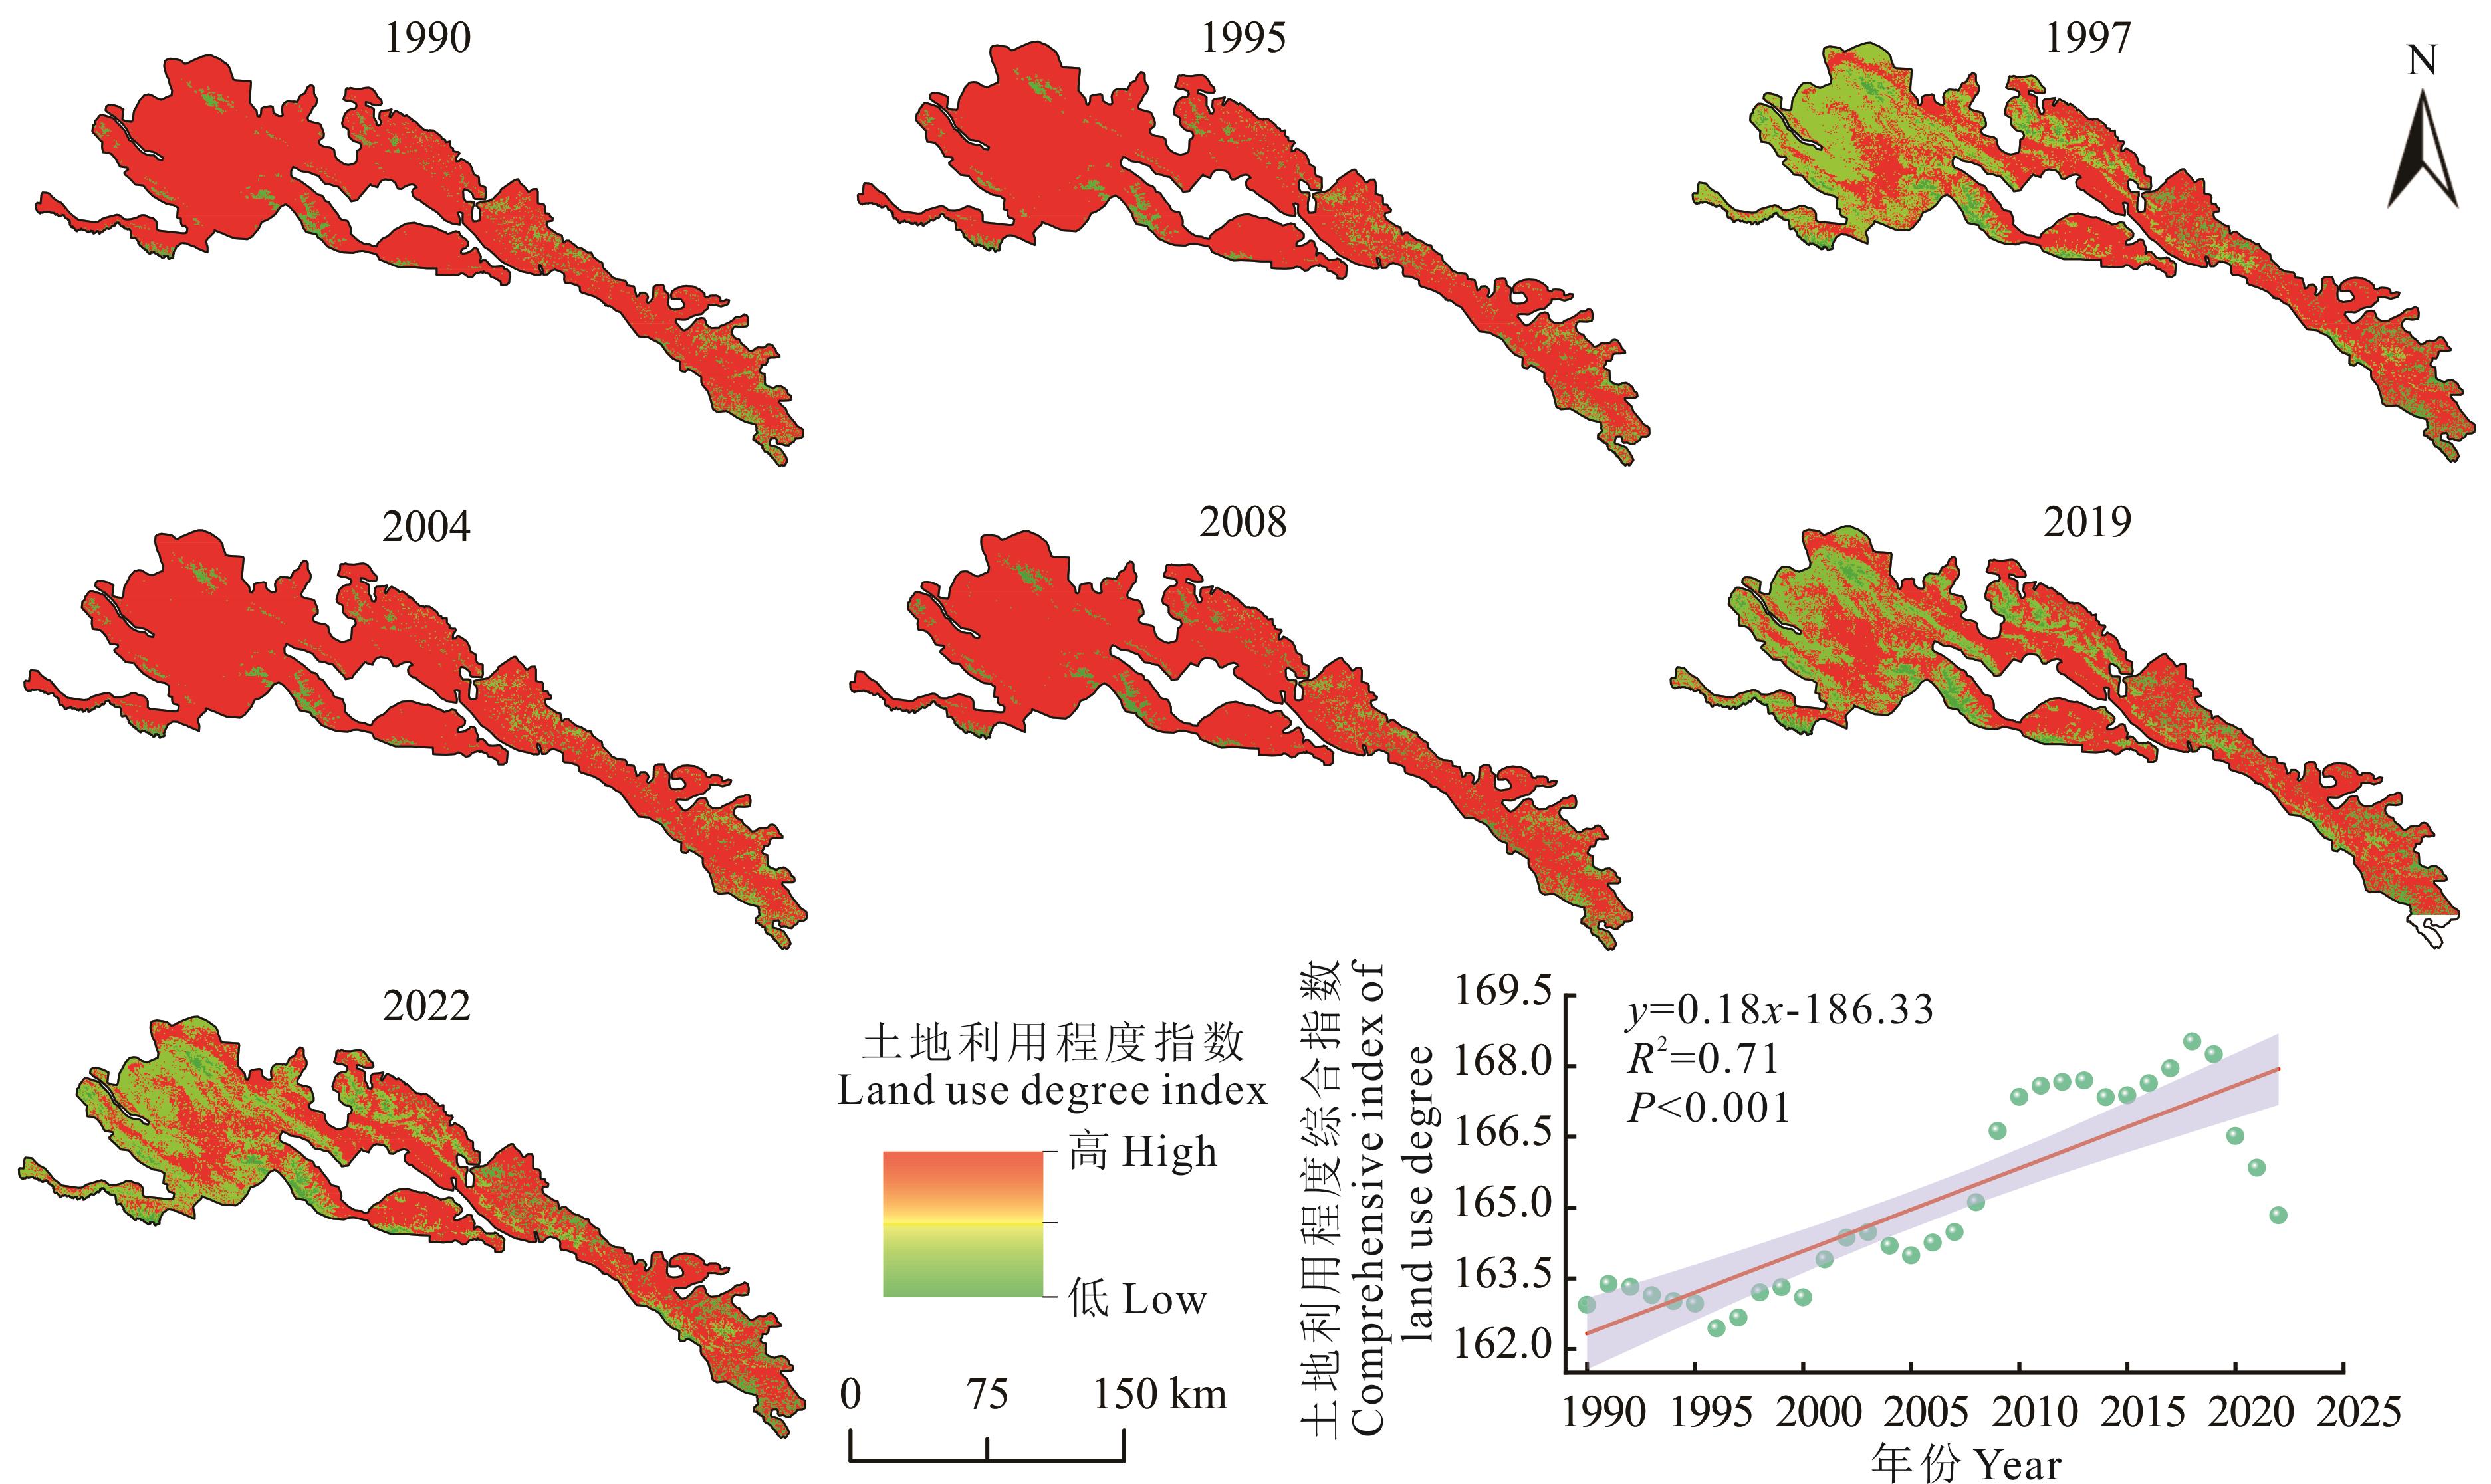
图6 典型年份的土地利用程度及土地利用综合程度指数基于自然资源部标准地图服务网GS(2020)4619号标准地图制作,底图边界无修改。Based on the standard map GS(2020)4619 from the Standard Map Service of the Ministry of Natural Resources, with no modification to the base map boundaries.
Fig.6 Land use degree and comprehensive index of land use degree for typical years
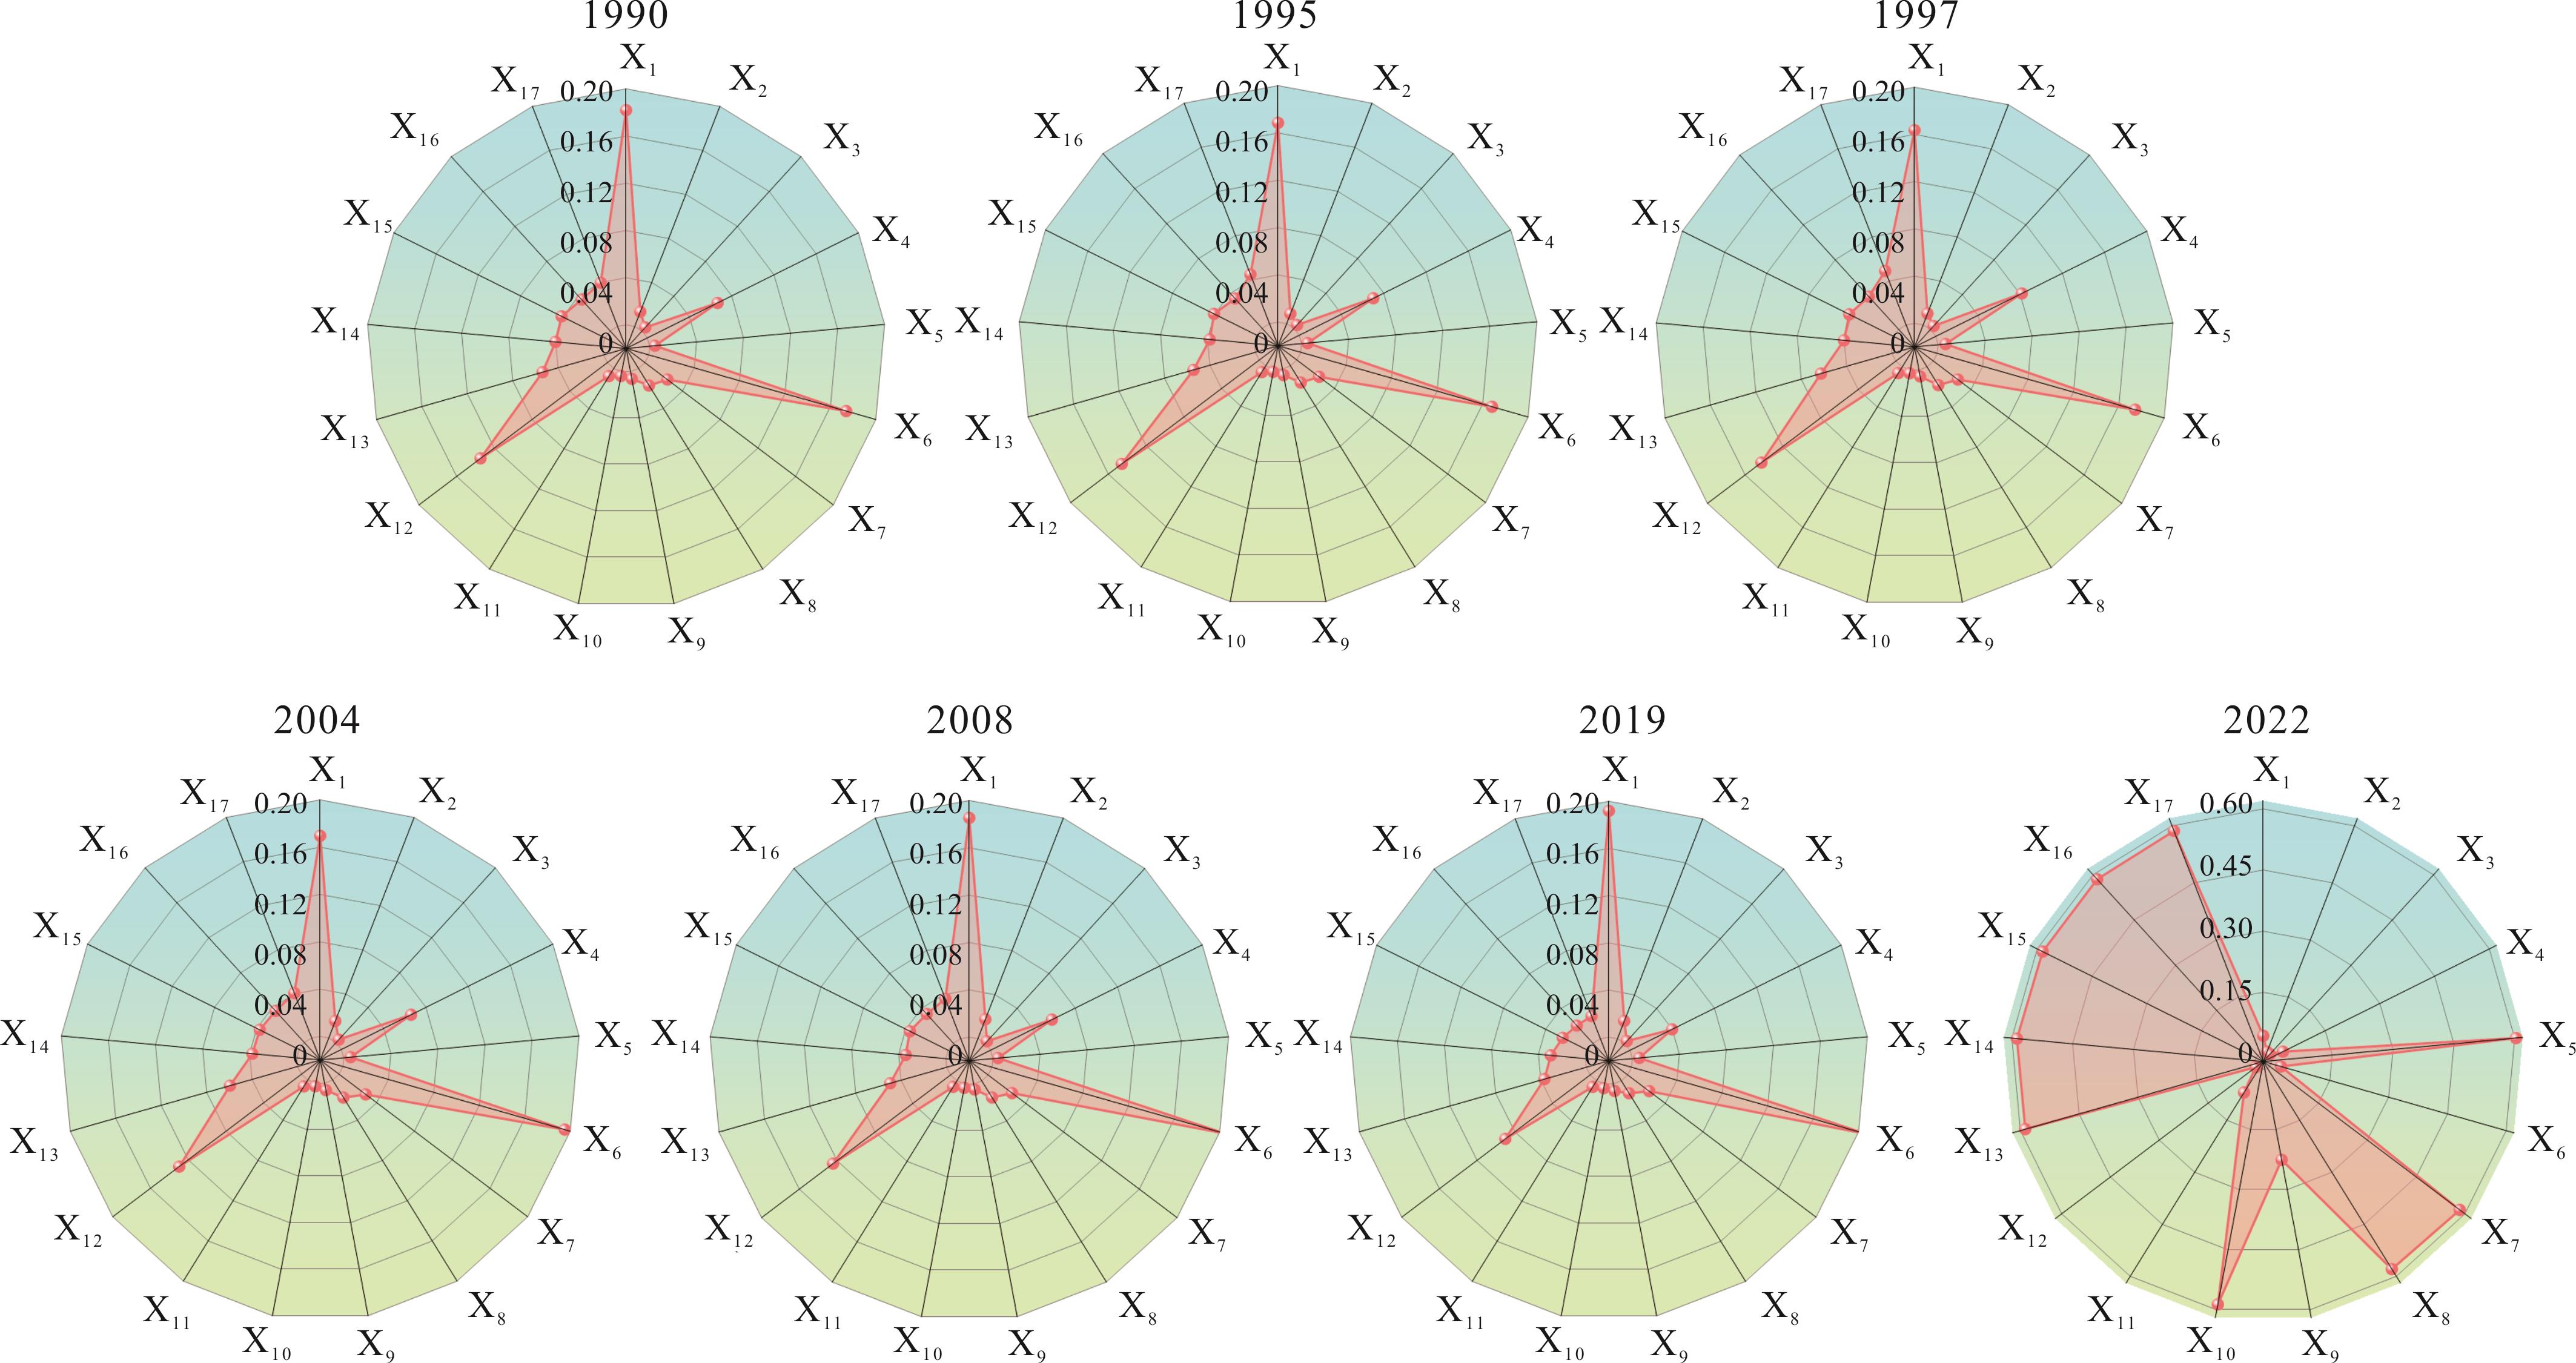
图7 典型年份土地利用程度驱动力X1~X17分别表示数字高程模型、坡度、坡向、降水量、气温、潜在蒸散发量、黏土含量、砂粒含量、细粉粒含量、国内生产总值、人口密度、人类足迹指数、林业工程、水土流失、化肥使用量、粮食总产量和受灾面积。X?-X?? represent the following variables: Digital elevation model (DEM), slope, aspect, precipitation, temperature, potential evapotranspiration, clay content, sand content, silt content, gross domestic product (GDP), population density, human footprint index, forestry projects, soil erosion, fertilizer usage, total grain output, and affected area by disasters. 下同The same below.
Fig.7 Driving forces of land use degree in typical years
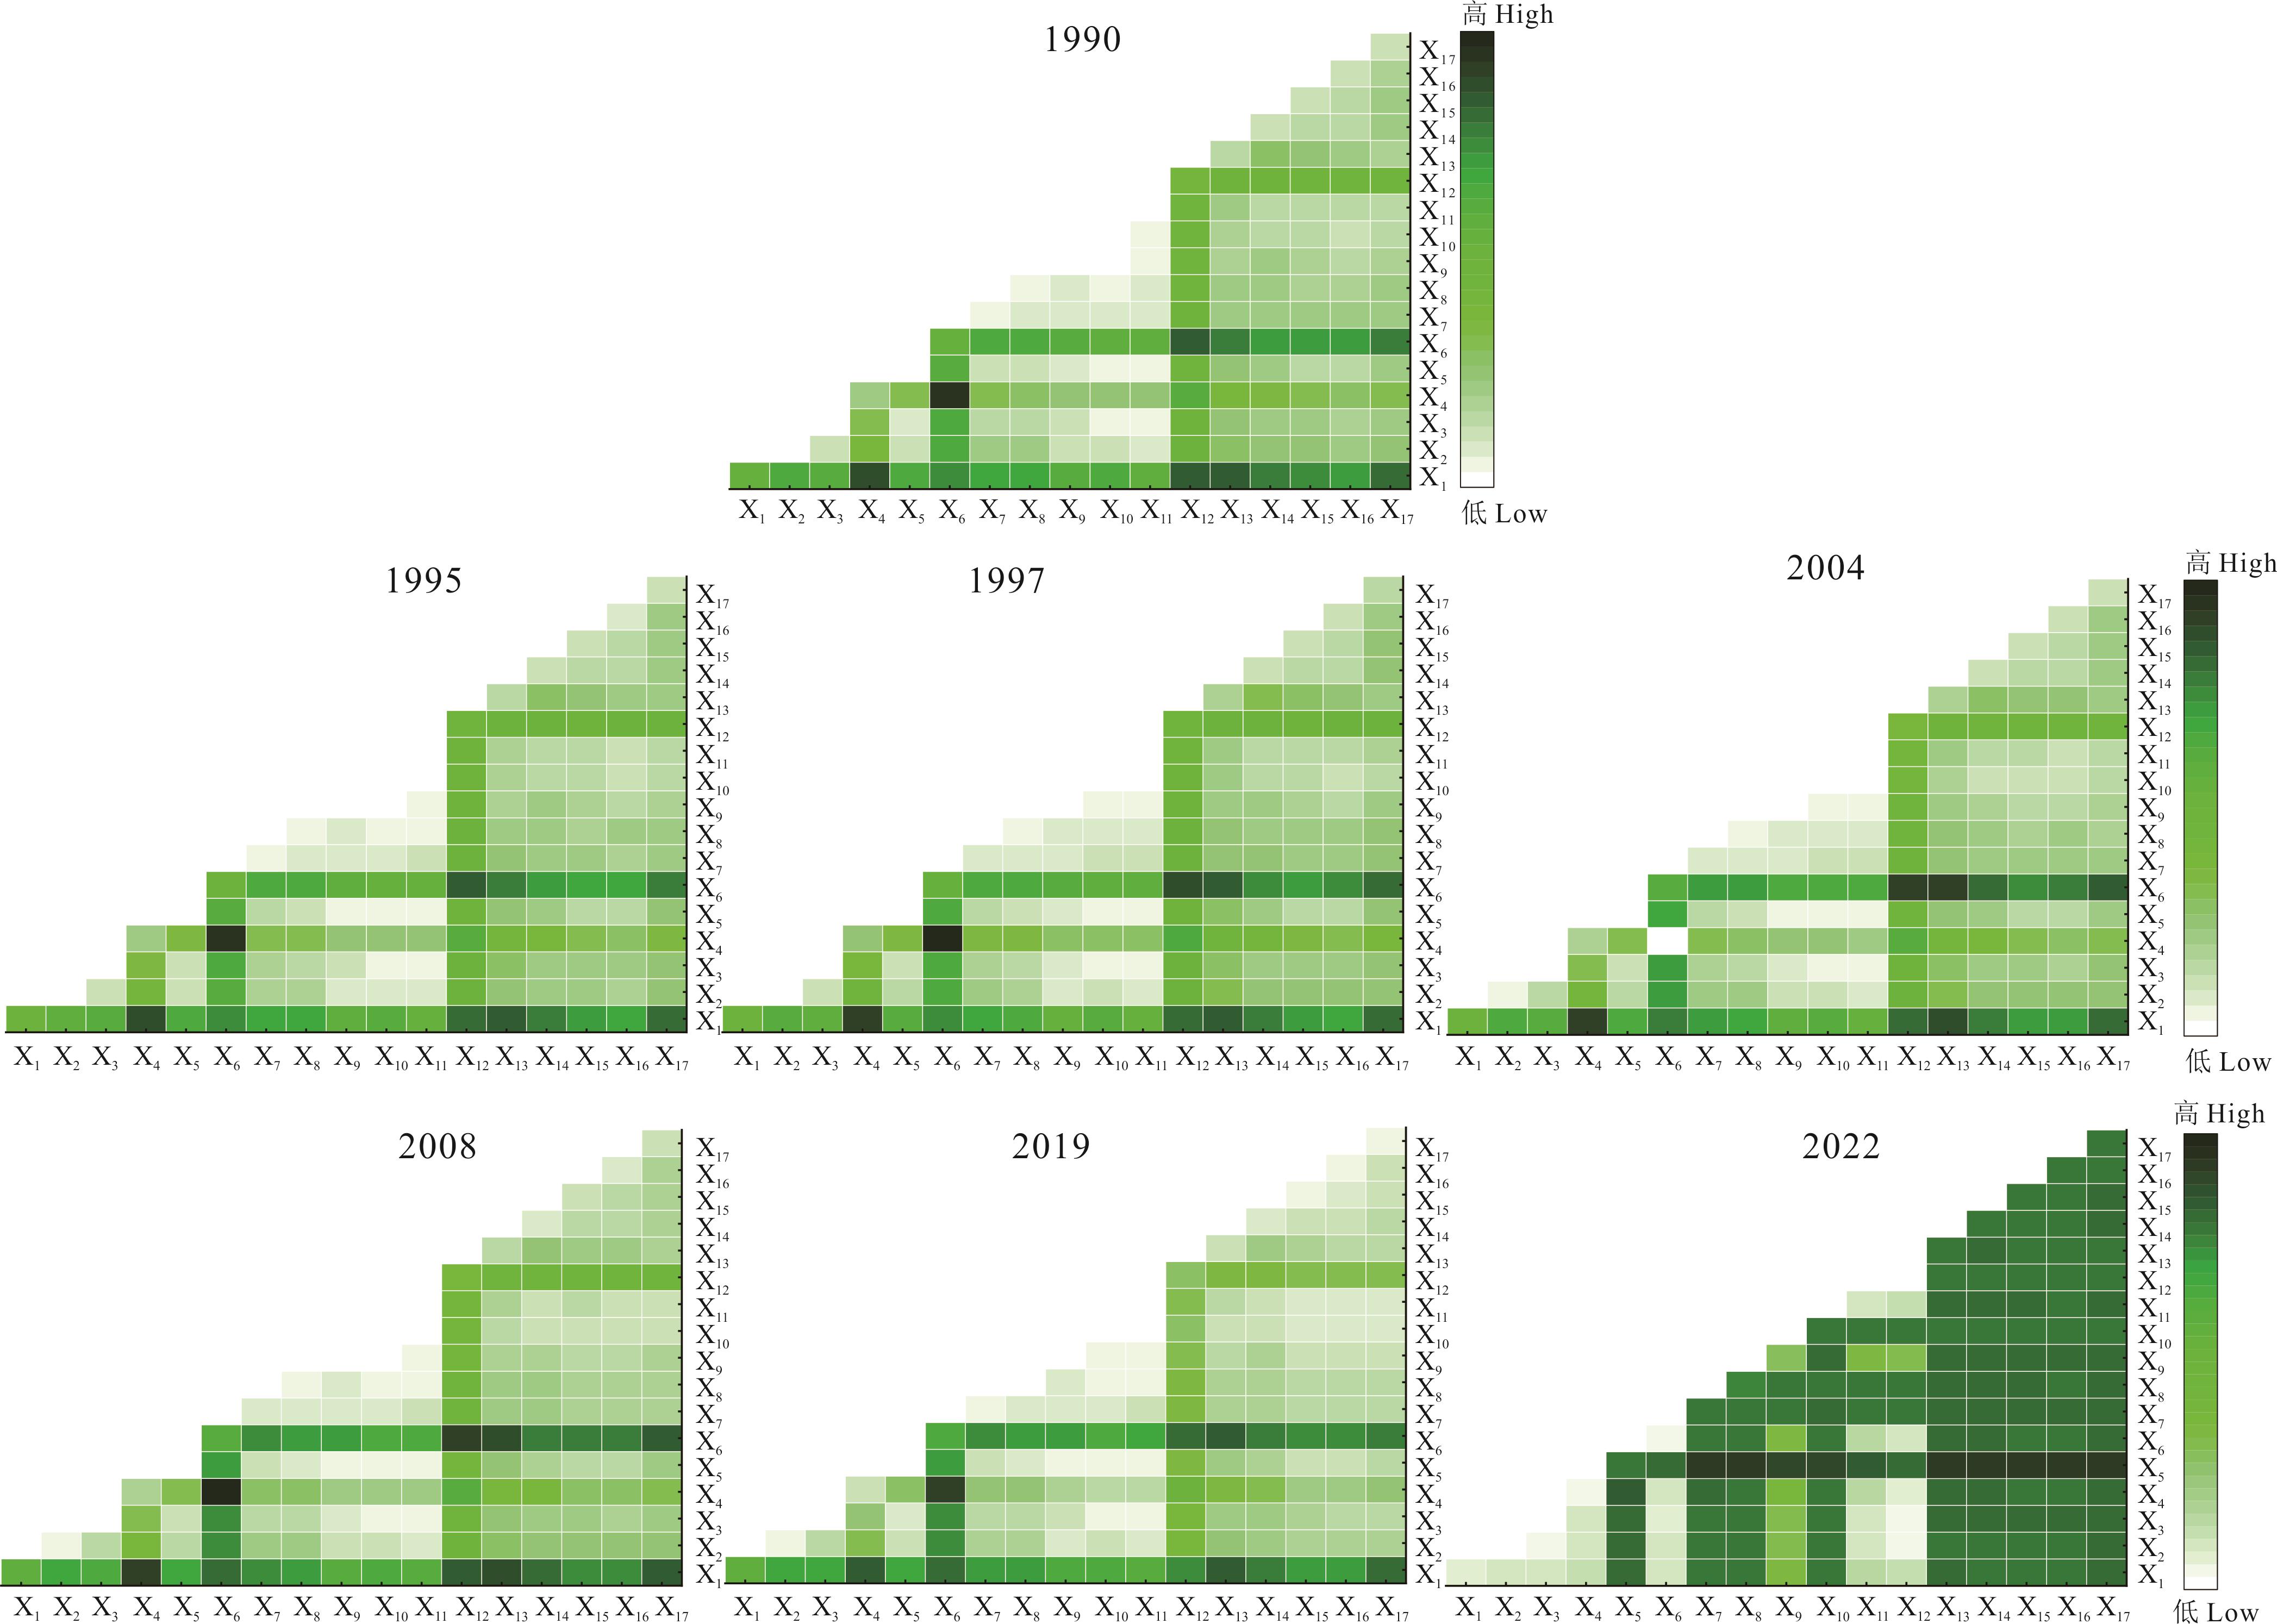
图8 典型年份土地利用程度的交互驱动图中颜色由浅至深表示不同影响因子对不同年份土地利用程度的交互作用,即评估两种影响因子共同作用时是否会增加或减弱土地利用程度的大小。The color gradient from light to dark indicates the interaction effects of different influencing factors on land-use intensity across years, reflecting whether their combined effects enhance or reduce the degree of land use.
Fig.8 Interaction-driven of land use degree in typical years
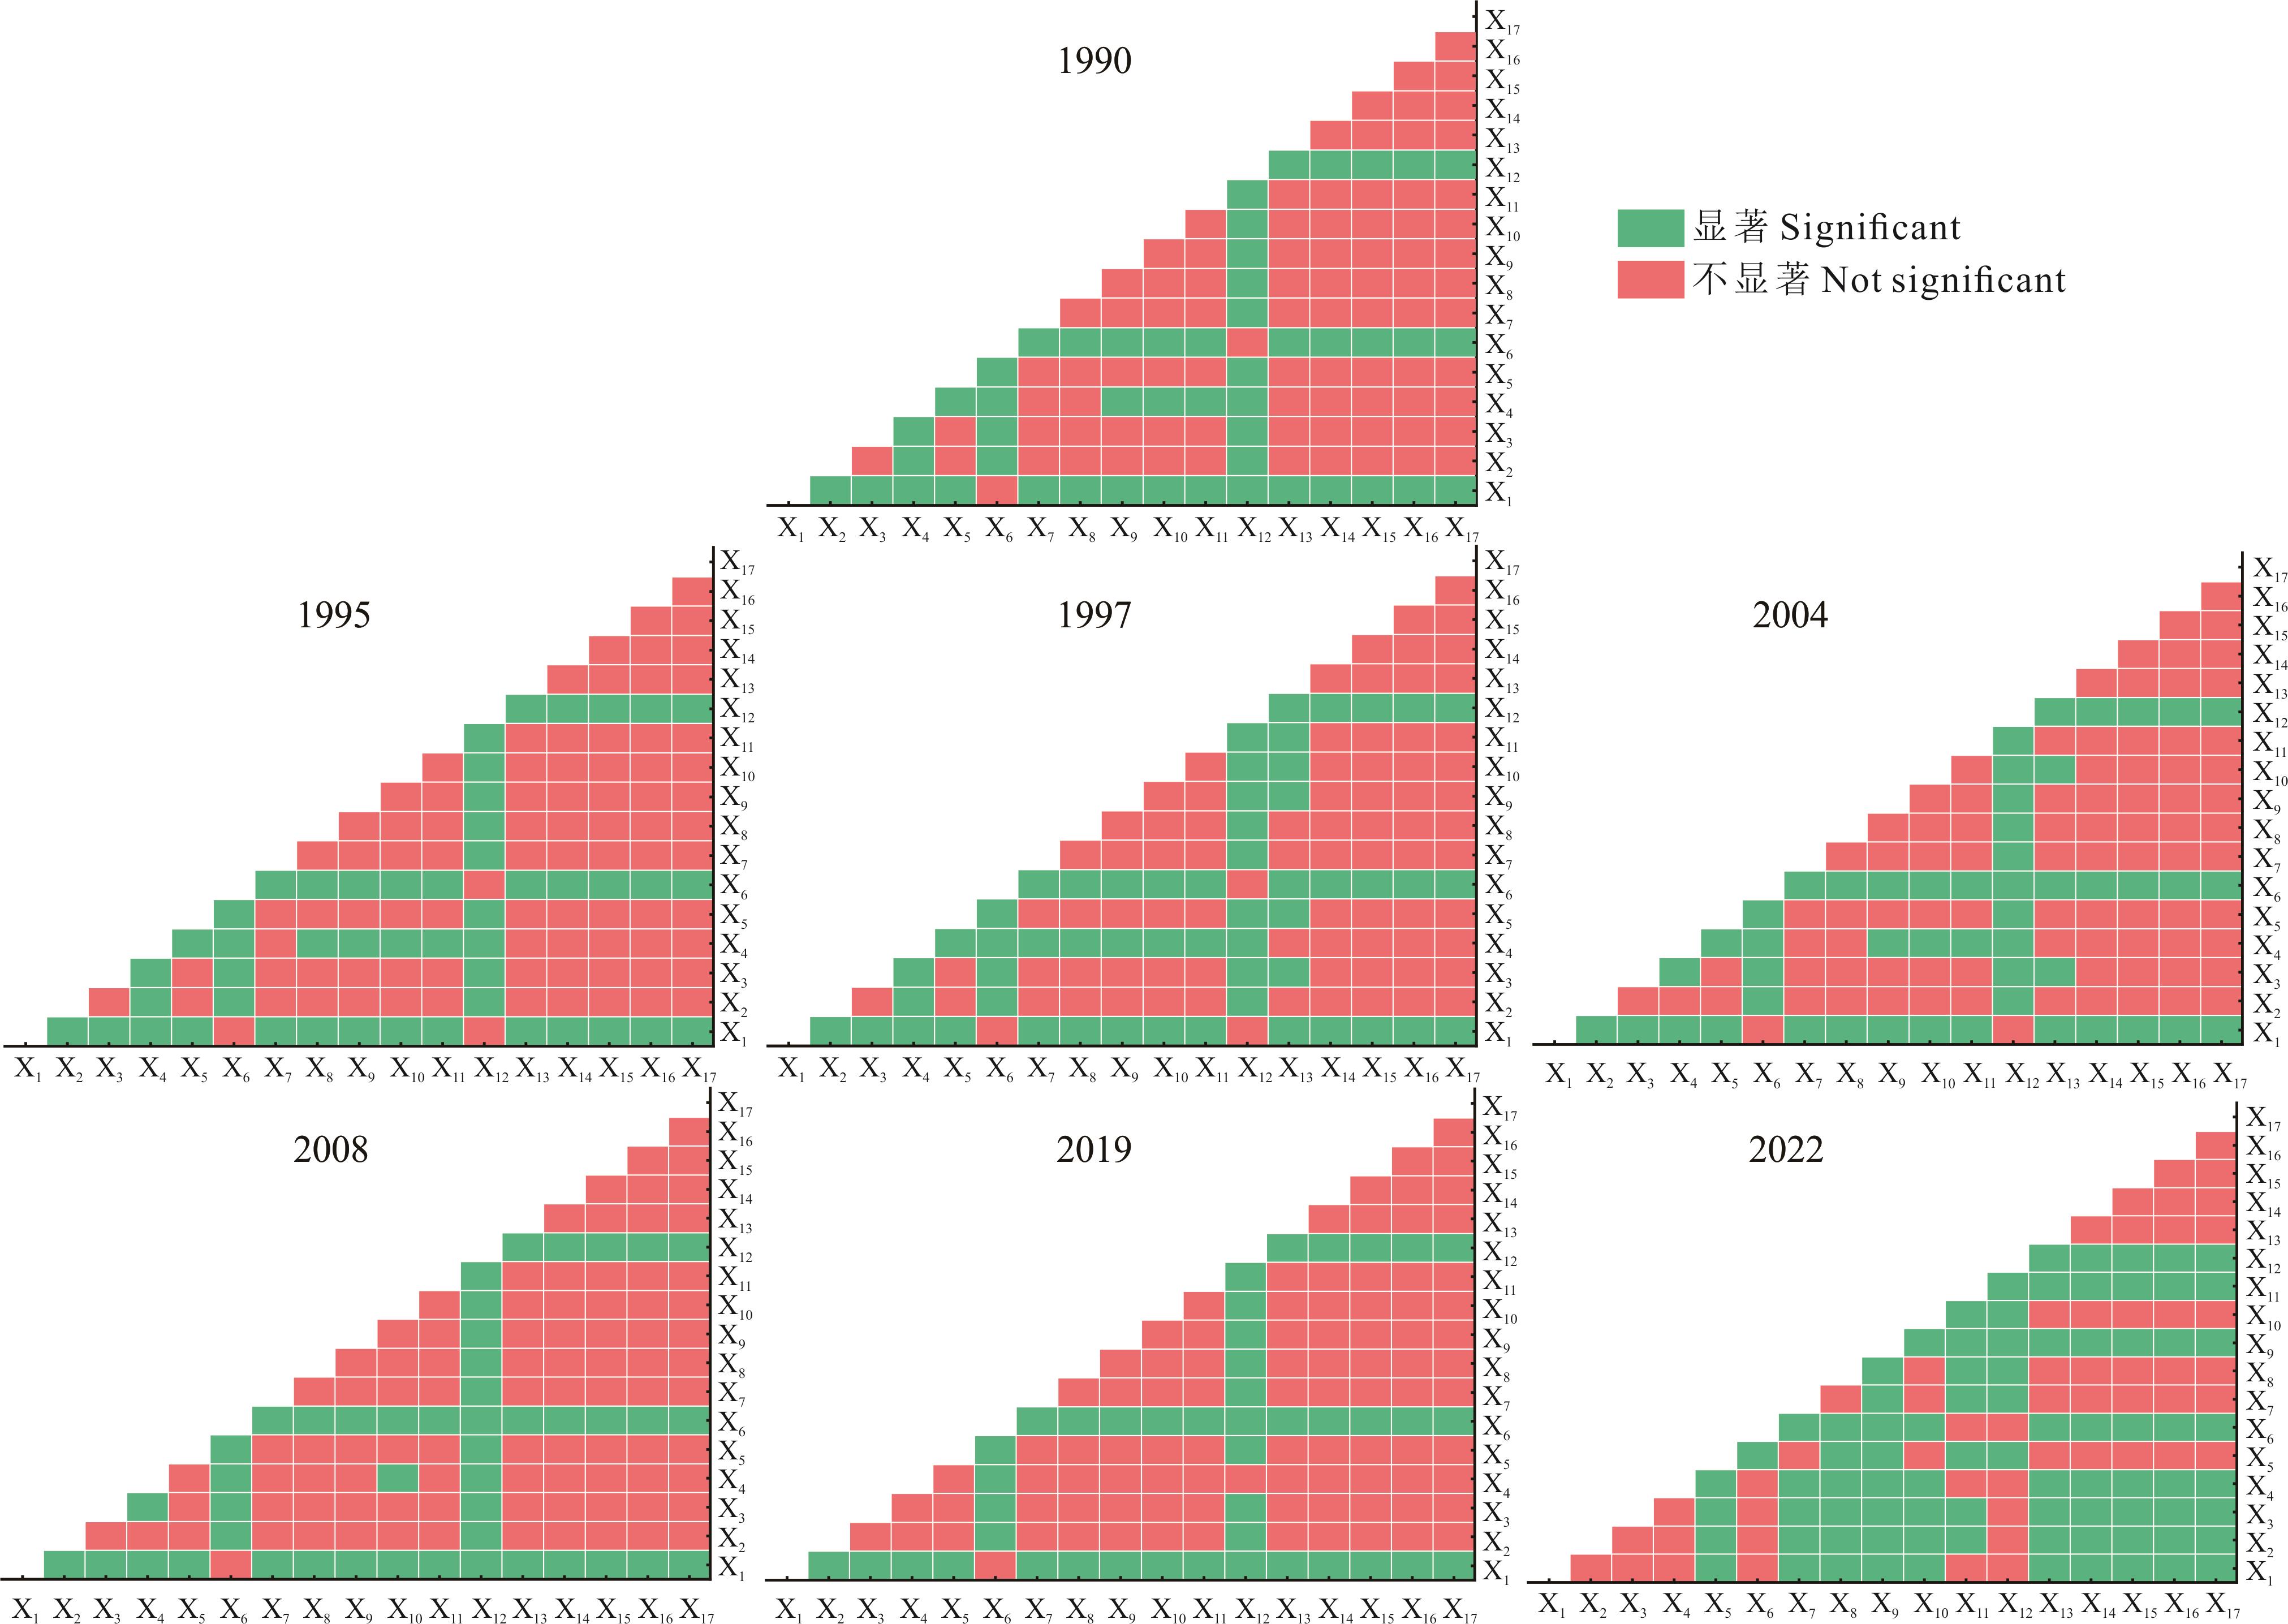
图9 典型年份土地利用程度的生态探测
Fig.9 Ecological detection of land use degree in typical years
| [1] | Aune-Lundberg L, Strand G H. Comparison of variance estimation methods for use with two-dimensional systematic sampling of land use/land cover data. Environmental Modelling & Software, 2014, 61(9): 87-97. |
| [2] | Talukdar S, Singha P, Mahato S, et al. Land-use land-cover classification by machine learning classifiers for satellite observations-A review. Remote Sensing, 2020, 12(7): 1135. |
| [3] | Hansen M C, Loveland T R. A review of large area monitoring of land cover change using Landsat data. Remote Sensing of Environment, 2012, 122(7): 66-74. |
| [4] | Dutta D, Rahman A, Paul S K, et al. Changing pattern of urban landscape and its effect on land surface temperature in and around Delhi. Environmental Monitoring and Assessment, 2019, 191(9): 551. |
| [5] | Borrelli P, Robinson D A, Panagos P, et al. Land use and climate change impacts on global soil erosion by water (2015-2070). Proceedings of the National Academy of Sciences of the United States of America, 2020, 117(36): 21994-22001. |
| [6] | Gao X, Huang X X, Chang S H, et al. Long-term improvements in water conservation functions at Qilian Mountain National Park, northwest China. Journal of Mountain Science, 2023, 20(10): 2885-2897. |
| [7] | Lu W Z, Xiao J F, Liu F, et al. Contrasting ecosystem CO2 fluxes of inland and coastal wetlands: a meta-analysis of eddy covariance data. Global Change Biology, 2017, 23(3): 1180-1198. |
| [8] | Hu S J, Niu Z G, Chen Y F, et al. Global wetlands: Potential distribution, wetland loss, and status. Science of the Total Environment, 2017, 586: 319-327. |
| [9] | Dumitrascu M, Himiyama Y, Gabrovec M, et al. Land use and land cover changes in a global environmental change context-the contribution of geography//Research directions, challenges and achievements of modern geography. Singapore: Springer Nature Singapore, 2023: 175-203. |
| [10] | Guarderas P, Smith F, Dufrene M. Land use and land cover change in a tropical mountain landscape of northern Ecuador: Altitudinal patterns and driving forces. PLoS One, 2022, 17(7): e0260191. |
| [11] | Shahfahad D, Kumari B, Tayyab M, et al. Assessment of public open spaces (POS) and landscape quality based on per capita POS index in Delhi, India. SN Applied Sciences, 2019, 1(4): 368. |
| [12] | Rahman A, Aggarwal S P, Netzband M, et al. Monitoring urban sprawl using remote sensing and GIS techniques of a fast growing urban centre, India. IEEE Journal of Selected Topics in Applied Earth Observations and Remote Sensing, 2011, 4(1): 56-64. |
| [13] | Zhang H, Han W H, Song J Y, et al. Spatio-temporal variations of habitat quality in Qilian Mountain National Park. Chinese Journal of Ecology, 2021, 40(5): 1419-1430. |
| 张华, 韩武宏, 宋金岳, 等. 祁连山国家公园生境质量时空演变. 生态学杂志, 2021, 40(5): 1419-1430. | |
| [14] | Yan K, Ding Y. The exploration of China’s National Park System Pilot Project: Taking Qilian Mountain National Park as an example. International Journal of Geoheritage and Parks, 2020, 8(4): 210-214. |
| [15] | Bičík I, Jeleček L. Land use and landscape changes in Czechia during the period of transition 1990-2007. Geografie, 2009, 114(4): 263-281. |
| [16] | Gabrovec M, Kumer P. Land-use changes in Slovenia from the Franciscean Cadaster until today. Acta Geographica Slovenica, 2019, 59(1): 11-26. |
| [17] | Deng Z W, Quan B, Zhang H B, et al. Scenario simulation of land use and cover under safeguarding ecological security: a case study of Chang-Zhu-Tan metropolitan area, China. Forests, 2023, 14(11): 2131. |
| [18] | Opedes H, Van Eupen M, Mücher C A, et al. Park conservation or degradation? iCLUE modelling of land use change projections in the upper Manafwa watershed on Mount Elgon, Uganda. Journal for Nature Conservation, 2023, 76(1): 126493. |
| [19] | Akumu C E, Dennis S. Urban land cover/use mapping and change detection analysis using multi-temporal Landsat OLI with LiDAR-DEM and derived TPI. Photogrammetric Engineering & Remote Sensing, 2022, 88(4): 243-253. |
| [20] | Chen W X, Yang L Y, Chi G Q, et al. Ecosystem degradation or restoration? The evolving role of land use in China, 2000-2020. Environmental Monitoring and Assessment, 2024, 196(3): 304. |
| [21] | Mao S Z, She J Y, Zhang Y. Spatial-temporal evolution of land use change and eco-environmental effects in the Chang-Zhu-Tan core area. Sustainability, 2023, 15(9): 7581. |
| [22] | Lai Y, Huang G Q, Chen S Z, et al. Land use dynamics and optimization from 2000 to 2020 in east Guangdong Province, China. Sustainability, 2021, 13(6): 3473. |
| [23] | Ngcinela S, Mushunje A, Taruvinga A, et al. Mapping the land use changes in cultivation areas of maize and soybean from 2006 to 2017 in the north west and free state provinces, south Africa. Agronomy, 2024, 14(5): 1002. |
| [24] | Cuba N. Research note: Sankey diagrams for visualizing land cover dynamics. Landscape and Urban Planning, 2015, 139(1): 163-167. |
| [25] | Lambin E F, Turner B L, Geist H J, et al. The causes of land-use and land-cover change: moving beyond the myths. Global Environmental Change, 2001, 11(4): 261-269. |
| [26] | Wang Z M, Mao D H, Li L, et al. Quantifying changes in multiple ecosystem services during 1992-2012 in the Sanjiang Plain of China. Science of the Total Environment, 2015, 514(1): 119-130. |
| [27] | Kleemann J, Baysal G, Bulley H N N, et al. Assessing driving forces of land use and land cover change by a mixed-method approach in north-eastern Ghana, West Africa. Journal of Environmental Management, 2017, 196(1): 411-442. |
| [28] | Vadrevu K P, Heinimann A, Gutman G, et al. Remote sensing of land use/cover changes in South and Southeast Asian Countries. International Journal of Digital Earth, 2019, 12(10): 1099-1102. |
| [29] | Alijani Z, Hosseinali F, Biswas A. Spatio-temporal evolution of agricultural land use change drivers: A case study from Chalous region, Iran. Journal of Environmental Management, 2020, 262(1): 110326. |
| [30] | Wang J, He T, Lin Y F. Changes in ecological, agricultural, and urban land space in 1984-2012 in China: Land policies and regional social-economical drivers. Habitat International, 2018, 71(1): 1-13. |
| [31] | Antwi-Agyei P, Dougill A J, Fraser E D G, et al. Characterising the nature of household vulnerability to climate variability: empirical evidence from two regions of Ghana. Environment, Development and Sustainability, 2013, 15(4): 903-926. |
| [32] | Rimal B, Paudel B, Rijal S, et al. Changing pattern and drivers of land use and land cover in Bagmati Province of Nepal. Himalayan Review, 2024, 1(1): 1-18. |
| [33] | Tasser E, Leitinger G, Tappeiner U. Climate change versus land-use change-What affects the mountain landscapes more? Land Use Policy, 2017, 60(1): 60-72. |
| [34] | Kim I, Le Q B, Park S J, et al. Driving forces in archetypical land-use changes in a mountainous watershed in East Asia. Land, 2014, 3(3): 957-980. |
| [35] | Petrisor A I, Sirodoev I, Ianos I. Trends in the national and regional transitional dynamics of land cover and use changes in Romania. Land, 2020, 9(2): 230. |
| [36] | Kolb M, Galicia L. Scenarios and story lines: drivers of land use change in southern Mexico. Environment, Development and Sustainability, 2018, 20(2): 681-702. |
| [37] | Wang L, Wu L, Zhang W. Impacts of land use change on landscape patterns in mountain human settlement: The case study of Hantai District (Shaanxi, China). Journal of Mountain Science, 2021, 18(3): 749-763. |
| [38] | Chauvier Y, Thuiller W, Brun P, et al. Influence of climate, soil, and land cover on plant species distribution in the European Alps. Ecological Monographs, 2021, 91(2): e01433. |
| [39] | Löffler J, Anschlag K, Baker B, et al. Mountain ecosystem response to global change. Erdkunde, 2011, 65(2): 189-213. |
| [40] | Keiler M, Kellerer-Pirklbauer A, Otto J. Preface: concepts and implications of environmental change and human impact: studies from Austrian geomorphological research. Geografiska Annaler: Series A-Physical Geography, 2012, 94(1): 1-5. |
| [41] | Jia Z M, Ma B R, Zhang J, et al. Simulating spatial-temporal changes of land-use based on ecological redline restrictions and landscape driving factors: A case study in Beijing. Sustainability, 2018, 10(4): 1299. |
| [42] | Ma L B, Zhu Z H, Li S X, et al. Analysis of spatial and temporal changes in human interference in important ecological function areas in China: the Gansu section of Qilian Mountain National Park as an example. Environmental Monitoring and Assessment, 2023, 195(9): 1029. |
| [43] | Yang J, Huang X. The 30 m annual land cover dataset and its dynamics in China from 1990 to 2019. Earth System Science Data, 2021, 13(8): 3907-3925. |
| [44] | Brockhoff R C, Biesbroek R, Van der Bolt B. Drought governance in transition: a case study of the Meuse River Basin in the Netherlands. Water Resources Management, 2022, 36(8): 2623-2638. |
| [45] | Fan X Y, Chen B, Fu C F, et al. Research on the influence of abrupt climate changes on the analysis of typical meteorological year in China. Energies, 2020, 13(24): 6531. |
| [46] | Jaiswal R K, Lohani A K, Tiwari H L. Statistical analysis for change detection and trend assessment in climatological parameters. Environmental Processes, 2015, 2(4): 729-749. |
| [47] | Zhou Q Z, Song Y, Zhang Y, et al. Land use transition and its effect on ecosystem service value with introducing “three wastes” factor in the industrial county, China. Environmental Science and Pollution Research, 2024, 31(1): 34962-34980. |
| [48] | Berdimbetov T, Shelton S, Pushpawela B, et al. Use of intensity analysis and transfer matrix to characterize land conversion in the Aral Sea Basin under changing climate. Modeling Earth Systems and Environment, 2024, 10(4): 4717-4729. |
| [49] | Shao Y T, Xiao Y, Sang W G. Land use trade-offs and synergies based on temporal and spatial patterns of ecosystem services in South China. Ecological Indicators, 2022, 143(1): 109335. |
| [50] | Wang S X, Zhang M, Xi X. Ecological environment evaluation based on remote sensing ecological index: a case study in East China over the past 20 years. Sustainability, 2022, 14(23): 15771. |
| [51] | Sun X Q, Yu Y H, Wang J L, et al. Analysis of the spatiotemporal variation in habitat quality based on the invest model-a case study of Shangri-La city, northwest Yunnan, China. Journal of Physics: Conference Series, 2021, 1961(1): 012016. |
| [52] | Yang H J, Gou X H, Xue B, et al. Research on the change of alpine ecosystem service value and its sustainable development path. Ecological Indicators, 2023, 146(1): 109893. |
| [53] | Renner M, Brust K, Schwärzel K, et al. Separating the effects of changes in land cover and climate: a hydro-meteorological analysis of the past 60 yr in Saxony, Germany. Hydrology and Earth System Sciences, 2014, 18(2): 641-658. |
| [54] | Wang X J, Liu G X, Xiang A C, et al. Terrain gradient response of landscape ecological environment to land use and land cover change in the hilly watershed in South China. Ecological Indicators, 2023, 146(1): 109797. |
| [55] | Wang X C, Dong X B, Liu H M, et al. Linking land use change, ecosystem services and human well-being: A case study of the Manas River Basin of Xinjiang, China. Ecosystem Services, 2017, 27(1): 113-123. |
| [56] | Mann H B. Nonparametric tests against trend. Econometrica, 1945, 13(3): 245. |
| [57] | Du R S, Shang F H, Ma N. Automatic mutation feature identification from well logging curves based on sliding t test algorithm. Cluster Computing, 2019, 22(2): 14841-14850. |
| [58] | Huang S Z, Huang Q, Chang J X, et al. Linkages between hydrological drought, climate indices and human activities: a case study in the Columbia River basin. International Journal of Climatology, 2016, 36(1): 364-373. |
| [59] | Wu X Y, Shen C, Shi L, et al. Spatio-temporal evolution characteristics and simulation prediction of carbon storage: A case study in Sanjiangyuan area, China. Ecological Informatics, 2024, 80(1): 102485. |
| [60] | Wang C, Li X M, Yuan C X. Study of the effects of land use change on water yield in the Qilian Mountains in western China. Ecological Indicators, 2024, 158: 111464. |
| [61] | Jiang F, Song P F, Gu H F, et al. New shortcut for boundary delimitation and functional zoning of national parks based on keystone species in China: A case study of Kunlun Mountains National Park. Ecological Indicators, 2024, 159(1): 111675. |
| [62] | Li Z W, Chen X Y, Qi J, et al. Accuracy assessment of land cover products in China from 2000 to 2020. Scientific Reports, 2023, 13(1): 12936. |
| [63] | Mehra N, Swain J B. Assessment of land use land cover change and its effects using artificial neural network-based cellular automation. Journal of Engineering and Applied Science, 2024, 71(1): 70. |
| [64] | Zuo Z Q, Yang Y Z, Wang R, et al. Analysis of the gains and losses of ecosystem service value under land use change and zoning in Qiqihar. Frontiers in Ecology and Evolution, 2023, 11(1): 1192952. |
| [65] | Vinatier F, Arnaiz A G. Using high-resolution multitemporal imagery to highlight severe land management changes in Mediterranean vineyards. Applied Geography, 2018, 90(1): 115-122. |
| [66] | Sinha R K, Eldho T I, Subimal G. Assessing the impacts of land cover and climate on runoff and sediment yield of a river basin. Hydrological Sciences Journal, 2020, 65(12): 2097-2115. |
| [67] | Zhang F, Kung H, Johnson V C. Assessment of land-cover/land-use change and landscape patterns in the two national nature reserves of Ebinur Lake Watershed, Xinjiang, China. Sustainability, 2017, 9(5): 724. |
| [68] | Wang Y M, Hu Y F, Niu X Y, et al. Myanmar’s land cover change and its driving factors during 2000-2020. International Journal of Environmental Research and Public Health, 2023, 20(3): 2409. |
| [69] | Zhu Y Y, Ling G H T. Spatio-temporal changes and driving forces analysis of urban open spaces in Shanghai between 1980 and 2020: an integrated geospatial approach. Remote Sensing, 2024, 16(7): 1184. |
| [70] | Yu L F, Chen Y, Sun W J, et al. Effects of grazing exclusion on soil carbon dynamics in alpine grasslands of the Tibetan Plateau. Geoderma, 2019, 353(1): 133-143. |
| [71] | Bax V, Francesconi W. Environmental predictors of forest change: An analysis of natural predisposition to deforestation in the tropical Andes region, Peru. Applied Geography, 2018, 91(8): 99-110. |
| [72] | Kanade R, John R. Topographical influence on recent deforestation and degradation in the Sikkim Himalaya in India; Implications for conservation of East Himalayan broadleaf forest. Applied Geography, 2018, 92(1): 85-93. |
| [73] | Mo C X, Bao M X, Lai S F, et al. Impact of future climate and land use changes on runoff in a typical Karst basin, southwest China. Water, 2023, 15(12): 2240. |
| [74] | Meng X M, Zhu Y, Yin M S, et al. The impact of land use and rainfall patterns on the soil loss of the hillslope. Scientific Reports, 2021, 11(1): 16341. |
| [75] | Hohensinner S, Atzler U, Fischer A, et al. Tracing the long-term evolution of land cover in an alpine valley 1820-2015 in the light of climate, glacier and land use changes. Frontiers in Environmental Science, 2021, 9(1): 683397. |
| [76] | Msofe N, Sheng L, Lyimo J. Land use change trends and their driving forces in the Kilombero Valley Floodplain, Southeastern Tanzania. Sustainability, 2019, 11(2): 505. |
| [77] | Jin Z Z, Zhao Q D, Qin X, et al. Quantifying the impact of landscape changes on hydrological variables in the alpine and cold region using hydrological model and remote sensing data. Hydrological Processes, 2021, 35(10): e14392. |
| [78] | Allan A, Soltani A, Abdi M H, et al. Driving forces behind land use and land cover change: A systematic and bibliometric review. Land, 2022, 11(8): 1222. |
| [79] | Rai M K, Paudel B, Zhang Y, et al. Appraisal of empirical studies on land-use and land-cover changes and their impact on ecosystem services in Nepal Himalaya. Sustainability, 2023, 15(9): 7134. |
| [1] | 敬一胜, 孙宗玖, 刘慧霞, 迪达尔·比苏力旦null, 李美莎, 周晨烨, 周磊, 于冰洁, 李有政, 郑丽, 阿斯太肯·居力海提null. 准噶尔盆地沙质荒漠草地土壤pH分布特征及其环境影响因素分析[J]. 草业学报, 2025, 34(7): 54-68. |
| [2] | 李军豪, 杨国靖, 裴孝东, 石贵, 王娅, 周立华. 青海省畜牧CO2排放强度的时空演变特征及其影响因素研究[J]. 草业学报, 2025, 34(3): 1-16. |
| [3] | 张聪, 王娅, 周立华, 裴孝东, 李军豪, 石贵. 牲畜饲养结构的时空分布特征及驱动因素——以宁夏为例[J]. 草业学报, 2024, 33(8): 37-49. |
| [4] | 赵亚楠, 王红梅, 李志丽, 张振杰, 陈彦硕, 苏荣霞. 荒漠草原灌丛转变过程土壤水分亏缺空间特征及影响因素[J]. 草业学报, 2024, 33(4): 22-34. |
| 阅读次数 | ||||||
|
全文 |
|
|||||
|
摘要 |
|
|||||