

ISSN 1004-5759 CN 62-1105/S
草业学报 ›› 2021, Vol. 30 ›› Issue (7): 72-81.DOI: 10.11686/cyxb2020596
李进1( ), 陈仕勇2,3(), 赵旭1, 田浩琦1, 陈智华2,3, 周青平1
收稿日期:2020-12-30
修回日期:2021-01-14
出版日期:2021-07-20
发布日期:2021-06-03
通讯作者:
陈仕勇
作者简介:Corresponding author. E-mail: chengshi8827@163.com基金资助:
Jin LI1(), Shi-yong CHEN2,3(), Xu ZHAO1, Hao-qi TIAN1, Zhi-hua CHEN2,3, Qing-ping ZHOU1
Received:2020-12-30
Revised:2021-01-14
Online:2021-07-20
Published:2021-06-03
Contact:
Shi-yong CHEN
摘要:
采用目标起始密码子多态性标记(SCoT)对目前国内种植利用的36个饲用燕麦品种进行了遗传变异结构及指纹图谱分析。结果显示,从80个SCoT引物中筛选出多态性较好、条带清晰且重复性高的引物15个,共扩增出146条条带,不同引物扩增出的多态性条带数为3~9条,平均为6.4条,多态性比率为65.75%,平均有效等位基因数(Ne)为1.46,平均Nei’s基因多样性指数为0.27,平均Shannon’s多样性指数为0.38。基于4个多态性较高的核心引物组扩增的14个位点,构建了36个燕麦品种的DNA指纹图谱,其能够将供试燕麦品种区分并准确鉴定。供试品种的DICE遗传相似性系数为0.7596~0.9507,平均值为0.8473;基于遗传相似系数的非加权组平均法(UPGMA)聚类分析结果显示,可将36个品种分为四大类,聚类与其来源的关联性不高。群体遗传结构分析表明,国外引进品种遗传组成分布均匀,有32.1%的品种具有混合来源,而国内品种分布相对集中且仅有25.0%的品种有混合来源,表明供试的国内种植利用的燕麦品种遗传基础较狭窄,来源相对单一。结果为燕麦品种的鉴定、新品种的选育等提供了理论参考。
李进, 陈仕勇, 赵旭, 田浩琦, 陈智华, 周青平. 基于SCoT标记的饲用燕麦品种遗传结构及指纹图谱分析[J]. 草业学报, 2021, 30(7): 72-81.
Jin LI, Shi-yong CHEN, Xu ZHAO, Hao-qi TIAN, Zhi-hua CHEN, Qing-ping ZHOU. Analysis of genetic structure and fingerprinting in oat varieties based on SCoT markers[J]. Acta Prataculturae Sinica, 2021, 30(7): 72-81.
| 序号No. | 品种名Variety name | 原产地Origin | 品种类型Type | 来源Source |
|---|---|---|---|---|
| 1 | 丹麦444 Denmark 444 | 丹麦 Denmark | 引进品种Introduced variety | 青海省畜牧兽医科学院 QAASVM |
| 2 | 林纳 Lena | 挪威Norway | 引进品种Introduced variety | 青海省畜牧兽医科学院 QAASVM |
| 3 | 青引1号 Qingyin No. 1 | 中国河北 Hebei, China | 引进品种Introduced variety | 青海省畜牧兽医科学院 QAASVM |
| 4 | 青引2号 Qingyin No. 2 | 加拿大 Canada | 引进品种Introduced variety | 青海省畜牧兽医科学院 QAASVM |
| 5 | 苏联燕麦 Soviet Union oat | 俄罗斯Russia | 引进品种Introduced variety | 青海省畜牧兽医科学院 QAASVM |
| 6 | 白燕7号 Baiyan No. 7 | 中国吉林Jilin, China | 育成品种Bred variety | 青海省畜牧兽医科学院 QAASVM |
| 7 | 青燕1号 Qingyan No. 1 | 中国青海Qinghai, China | 育成品种Bred variety | 青海省畜牧兽医科学院 QAASVM |
| 8 | 青莜3号Qingyou No. 3 | 英国 England | 引进品种Introduced variety | 青海省畜牧兽医科学院 QAASVM |
| 9 | 阿坝 Aba | 中国四川Sichuan, China | 地方品种Local variety | 四川省草原科学研究院 SCAGS |
| 10 | 加燕2号 Jiayan No. 2 | 加拿大 Canada | 引进品种Introduced variety | 青海省畜牧兽医科学院 QAASVM |
| 11 | 陇燕1号 Longyan No. 1 | 中国甘肃Gansu, China | 育成品种Bred variety | 甘肃农业大学GSAU |
| 12 | 陇燕2号 Longyan No. 2 | 中国甘肃Gansu, China | 育成品种Bred variety | 甘肃农业大学GSAU |
| 13 | 陇燕3号 Longyan No. 3 | 中国甘肃Gansu, China | 育成品种Bred variety | 甘肃农业大学GSAU |
| 14 | 陇燕4号 Longyan No. 4 | 中国甘肃Gansu, China | 育成品种Bred variety | 甘肃农业大学GSAU |
| 15 | 陇燕5号 Longyan No. 5 | 中国甘肃Gansu, China | 育成品种Bred variety | 甘肃农业大学GSAU |
| 16 | 燕王Forage plus | 美国America | 引进品种Introduced variety | 北京正道 Beijing Rytway |
| 17 | 骏马 Cayuse | 加拿大Canada | 引进品种Introduced variety | 北京百斯特Beijing Best Seed |
| 18 | 牧王Haymaker | 加拿大Canada | 引进品种Introduced variety | 北京正道 Beijing Rytway |
| 19 | 锋利 Sharp | 加拿大Canada | 引进品种Introduced variety | 北京正道 Beijing Rytway |
| 20 | 边锋 Blade | 美国America | 引进品种Introduced variety | 北京正道 Beijing Rytway |
| 21 | 牧乐思 Molasses | 加拿大Canada | 引进品种Introduced variety | 北京正道 Beijing Rytway |
| 22 | 领袖Souris | 加拿大Canada | 引进品种Introduced variety | 北京正道 Beijing Rytway |
| 23 | 梦龙 Magnum | 美国America | 引进品种Introduced variety | 北京百斯特Beijing Best Seed |
| 24 | 莫妮卡 Monica | 美国America | 引进品种Introduced variety | 北京百斯特Beijing Best Seed |
| 25 | 爱沃126 Everleaf 126 | 美国America | 引进品种Introduced variety | 北京正道 Beijing Rytway |
| 26 | 科纳 Kona | 美国America | 引进品种Introduced variety | 猛犸种业Mammoth Seed |
| 27 | 贝勒 Baler | 加拿大Canada | 引进品种Introduced variety | 北京正道 Beijing Rytway |
| 28 | 贝勒 Ⅱ Baler Ⅱ | 加拿大Canada | 引进品种Introduced variety | 北京正道 Beijing Rytway |
| 29 | 哈维 Haywire | 加拿大Canada | 引进品种Introduced variety | 北京百斯特Beijing Best Seed |
| 30 | 太阳神 Titan | 美国America | 引进品种Introduced variety | 北京正道 Beijing Rytway |
| 31 | 美达 Monida | 美国America | 引进品种Introduced variety | 北京正道 Beijing Rytway |
| 32 | 魅力Charisma | 美国America | 引进品种Introduced variety | 北京正道 Beijing Rytway |
| 33 | 海神 Sea god | 美国America | 引进品种Introduced variety | 猛犸种业Mammoth Seed |
| 34 | 伽利略 Galileo | 澳大利亚Australia | 引进品种Introduced variety | 百绿(天津) Barenbrug China (Tianjin) |
| 35 | 枪手 Shooter | 加拿大Canada | 引进品种Introduced variety | 百绿(天津) Barenbrug China (Tianjin) |
| 36 | 禾王 King cereals | 美国America | 引进品种Introduced variety | 百绿(天津) Barenbrug China (Tianjin) |
表1 试验材料及来源
Table 1 Materials used in the study
| 序号No. | 品种名Variety name | 原产地Origin | 品种类型Type | 来源Source |
|---|---|---|---|---|
| 1 | 丹麦444 Denmark 444 | 丹麦 Denmark | 引进品种Introduced variety | 青海省畜牧兽医科学院 QAASVM |
| 2 | 林纳 Lena | 挪威Norway | 引进品种Introduced variety | 青海省畜牧兽医科学院 QAASVM |
| 3 | 青引1号 Qingyin No. 1 | 中国河北 Hebei, China | 引进品种Introduced variety | 青海省畜牧兽医科学院 QAASVM |
| 4 | 青引2号 Qingyin No. 2 | 加拿大 Canada | 引进品种Introduced variety | 青海省畜牧兽医科学院 QAASVM |
| 5 | 苏联燕麦 Soviet Union oat | 俄罗斯Russia | 引进品种Introduced variety | 青海省畜牧兽医科学院 QAASVM |
| 6 | 白燕7号 Baiyan No. 7 | 中国吉林Jilin, China | 育成品种Bred variety | 青海省畜牧兽医科学院 QAASVM |
| 7 | 青燕1号 Qingyan No. 1 | 中国青海Qinghai, China | 育成品种Bred variety | 青海省畜牧兽医科学院 QAASVM |
| 8 | 青莜3号Qingyou No. 3 | 英国 England | 引进品种Introduced variety | 青海省畜牧兽医科学院 QAASVM |
| 9 | 阿坝 Aba | 中国四川Sichuan, China | 地方品种Local variety | 四川省草原科学研究院 SCAGS |
| 10 | 加燕2号 Jiayan No. 2 | 加拿大 Canada | 引进品种Introduced variety | 青海省畜牧兽医科学院 QAASVM |
| 11 | 陇燕1号 Longyan No. 1 | 中国甘肃Gansu, China | 育成品种Bred variety | 甘肃农业大学GSAU |
| 12 | 陇燕2号 Longyan No. 2 | 中国甘肃Gansu, China | 育成品种Bred variety | 甘肃农业大学GSAU |
| 13 | 陇燕3号 Longyan No. 3 | 中国甘肃Gansu, China | 育成品种Bred variety | 甘肃农业大学GSAU |
| 14 | 陇燕4号 Longyan No. 4 | 中国甘肃Gansu, China | 育成品种Bred variety | 甘肃农业大学GSAU |
| 15 | 陇燕5号 Longyan No. 5 | 中国甘肃Gansu, China | 育成品种Bred variety | 甘肃农业大学GSAU |
| 16 | 燕王Forage plus | 美国America | 引进品种Introduced variety | 北京正道 Beijing Rytway |
| 17 | 骏马 Cayuse | 加拿大Canada | 引进品种Introduced variety | 北京百斯特Beijing Best Seed |
| 18 | 牧王Haymaker | 加拿大Canada | 引进品种Introduced variety | 北京正道 Beijing Rytway |
| 19 | 锋利 Sharp | 加拿大Canada | 引进品种Introduced variety | 北京正道 Beijing Rytway |
| 20 | 边锋 Blade | 美国America | 引进品种Introduced variety | 北京正道 Beijing Rytway |
| 21 | 牧乐思 Molasses | 加拿大Canada | 引进品种Introduced variety | 北京正道 Beijing Rytway |
| 22 | 领袖Souris | 加拿大Canada | 引进品种Introduced variety | 北京正道 Beijing Rytway |
| 23 | 梦龙 Magnum | 美国America | 引进品种Introduced variety | 北京百斯特Beijing Best Seed |
| 24 | 莫妮卡 Monica | 美国America | 引进品种Introduced variety | 北京百斯特Beijing Best Seed |
| 25 | 爱沃126 Everleaf 126 | 美国America | 引进品种Introduced variety | 北京正道 Beijing Rytway |
| 26 | 科纳 Kona | 美国America | 引进品种Introduced variety | 猛犸种业Mammoth Seed |
| 27 | 贝勒 Baler | 加拿大Canada | 引进品种Introduced variety | 北京正道 Beijing Rytway |
| 28 | 贝勒 Ⅱ Baler Ⅱ | 加拿大Canada | 引进品种Introduced variety | 北京正道 Beijing Rytway |
| 29 | 哈维 Haywire | 加拿大Canada | 引进品种Introduced variety | 北京百斯特Beijing Best Seed |
| 30 | 太阳神 Titan | 美国America | 引进品种Introduced variety | 北京正道 Beijing Rytway |
| 31 | 美达 Monida | 美国America | 引进品种Introduced variety | 北京正道 Beijing Rytway |
| 32 | 魅力Charisma | 美国America | 引进品种Introduced variety | 北京正道 Beijing Rytway |
| 33 | 海神 Sea god | 美国America | 引进品种Introduced variety | 猛犸种业Mammoth Seed |
| 34 | 伽利略 Galileo | 澳大利亚Australia | 引进品种Introduced variety | 百绿(天津) Barenbrug China (Tianjin) |
| 35 | 枪手 Shooter | 加拿大Canada | 引进品种Introduced variety | 百绿(天津) Barenbrug China (Tianjin) |
| 36 | 禾王 King cereals | 美国America | 引进品种Introduced variety | 百绿(天津) Barenbrug China (Tianjin) |
| 序号No. | 引物编号Primer No. | 序列Sequence (5′-3′) | 退火温度 Annealing temperature (℃) | 总带数 Total number of bands | 多态性带数Number of polymorphic bands | 多态带比率 Percentage of polymorphic bands (%) | 有效等位基因数Effective number of alleles (Ne) | 基因多样性指数Nei’s gene diversity (H) | Shannon指数Shannon’s index (I) |
|---|---|---|---|---|---|---|---|---|---|
| 1 | SCoT37 | CAATGGCTACCACTAGCC | 54.0 | 10 | 3 | 30.0 | 1.15 | 0.10 | 0.15 |
| 2 | SCoT38 | CAATGGCTACCACTAACG | 48.4 | 9 | 5 | 55.6 | 1.41 | 0.23 | 0.33 |
| 3 | SCoT39 | CAATGGCTACCACTAGCG | 51.7 | 10 | 5 | 50.0 | 1.21 | 0.15 | 0.23 |
| 4 | SCoT45 | ACAATGGCTACCACTGAC | 53.5 | 10 | 6 | 60.0 | 1.52 | 0.30 | 0.44 |
| 5 | SCoT46 | ACAATGGCTACCACTGAG | 51.7 | 10 | 9 | 90.0 | 1.80 | 0.44 | 0.62 |
| 6 | SCoT48 | ACAATGGCTACCACTGGC | 51.7 | 10 | 8 | 80.0 | 1.51 | 0.30 | 0.44 |
| 7 | SCoT50 | ACAATGGCTACCACTGGG | 53.5 | 12 | 10 | 83.3 | 1.57 | 0.33 | 0.48 |
| 8 | SCoT51 | ACAATGGCTACCACTGTC | 51.7 | 9 | 7 | 77.8 | 1.49 | 0.29 | 0.43 |
| 9 | SCoT53 | ACAATGGCTACCACCGAC | 54.0 | 8 | 6 | 75.0 | 1.52 | 0.30 | 0.44 |
| 10 | SCoT56 | ACAATGGCTACCACTAGC | 54.0 | 8 | 4 | 50.0 | 1.41 | 0.22 | 0.32 |
| 11 | SCoT57 | ACAATGGCTACCACTACG | 51.7 | 12 | 8 | 66.7 | 1.48 | 0.27 | 0.39 |
| 12 | SCoT66 | ACCATGGCTACCAGCGAG | 52.8 | 8 | 5 | 62.5 | 1.40 | 0.24 | 0.26 |
| 13 | SCoT75 | CCATGGCTACCACCGGAG | 53.5 | 14 | 9 | 64.3 | 1.46 | 0.26 | 0.38 |
| 14 | SCoT77 | CCATGGCTACCACTACCC | 53.5 | 10 | 6 | 60.0 | 1.48 | 0.26 | 0.37 |
| 15 | SCoT80 | CCATGGCTACCACTAGCG | 51.7 | 6 | 5 | 83.3 | 1.54 | 0.32 | 0.48 |
| 平均数Mean | 9.7 | 6.4 | 65.75 | 1.46 | 0.27 | 0.38 | |||
| 总数Total | 146 | 96 | |||||||
表2 15个SCoT引物扩增结果
Table 2 The amplified results of 15 SCoT primers
| 序号No. | 引物编号Primer No. | 序列Sequence (5′-3′) | 退火温度 Annealing temperature (℃) | 总带数 Total number of bands | 多态性带数Number of polymorphic bands | 多态带比率 Percentage of polymorphic bands (%) | 有效等位基因数Effective number of alleles (Ne) | 基因多样性指数Nei’s gene diversity (H) | Shannon指数Shannon’s index (I) |
|---|---|---|---|---|---|---|---|---|---|
| 1 | SCoT37 | CAATGGCTACCACTAGCC | 54.0 | 10 | 3 | 30.0 | 1.15 | 0.10 | 0.15 |
| 2 | SCoT38 | CAATGGCTACCACTAACG | 48.4 | 9 | 5 | 55.6 | 1.41 | 0.23 | 0.33 |
| 3 | SCoT39 | CAATGGCTACCACTAGCG | 51.7 | 10 | 5 | 50.0 | 1.21 | 0.15 | 0.23 |
| 4 | SCoT45 | ACAATGGCTACCACTGAC | 53.5 | 10 | 6 | 60.0 | 1.52 | 0.30 | 0.44 |
| 5 | SCoT46 | ACAATGGCTACCACTGAG | 51.7 | 10 | 9 | 90.0 | 1.80 | 0.44 | 0.62 |
| 6 | SCoT48 | ACAATGGCTACCACTGGC | 51.7 | 10 | 8 | 80.0 | 1.51 | 0.30 | 0.44 |
| 7 | SCoT50 | ACAATGGCTACCACTGGG | 53.5 | 12 | 10 | 83.3 | 1.57 | 0.33 | 0.48 |
| 8 | SCoT51 | ACAATGGCTACCACTGTC | 51.7 | 9 | 7 | 77.8 | 1.49 | 0.29 | 0.43 |
| 9 | SCoT53 | ACAATGGCTACCACCGAC | 54.0 | 8 | 6 | 75.0 | 1.52 | 0.30 | 0.44 |
| 10 | SCoT56 | ACAATGGCTACCACTAGC | 54.0 | 8 | 4 | 50.0 | 1.41 | 0.22 | 0.32 |
| 11 | SCoT57 | ACAATGGCTACCACTACG | 51.7 | 12 | 8 | 66.7 | 1.48 | 0.27 | 0.39 |
| 12 | SCoT66 | ACCATGGCTACCAGCGAG | 52.8 | 8 | 5 | 62.5 | 1.40 | 0.24 | 0.26 |
| 13 | SCoT75 | CCATGGCTACCACCGGAG | 53.5 | 14 | 9 | 64.3 | 1.46 | 0.26 | 0.38 |
| 14 | SCoT77 | CCATGGCTACCACTACCC | 53.5 | 10 | 6 | 60.0 | 1.48 | 0.26 | 0.37 |
| 15 | SCoT80 | CCATGGCTACCACTAGCG | 51.7 | 6 | 5 | 83.3 | 1.54 | 0.32 | 0.48 |
| 平均数Mean | 9.7 | 6.4 | 65.75 | 1.46 | 0.27 | 0.38 | |||
| 总数Total | 146 | 96 | |||||||

图1 引物SCoT48对燕麦品种的扩增结果编号1~36详见于表1,下同;M为DL2000 marker。No. 1-36 samples were listed in Table 1. The same below. M: DL2000 marker.
Fig.1 Amplified results of SCoT48 primer
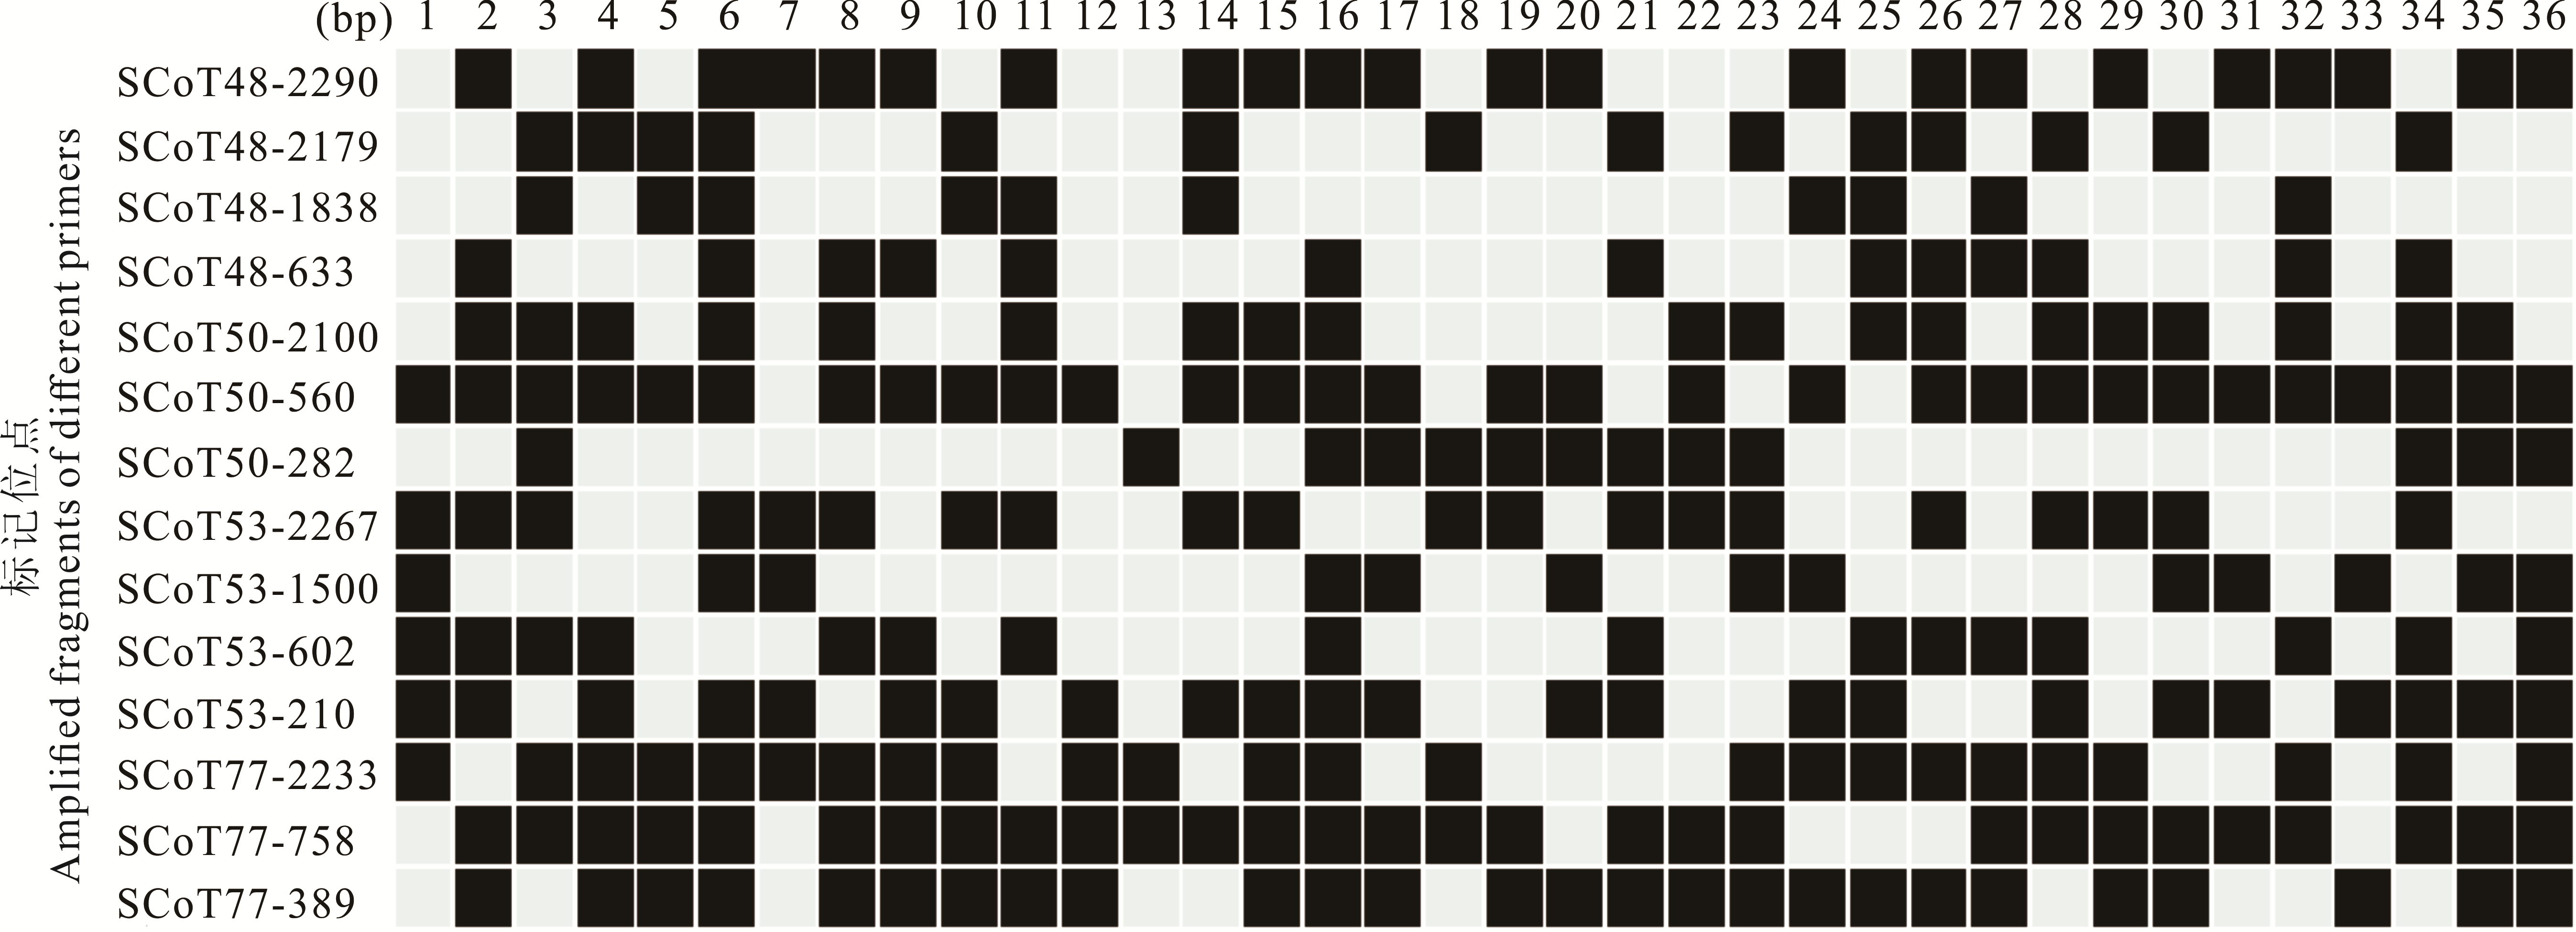
图2 供试燕麦品种指纹图谱
Fig.2 Fingerprinting of 36 oat varieties

图3 SCoT标记对36份燕麦品种亲缘关系聚类分析D1,D2:遗传相似性系数阈值Genetic similarity coefficient threshold.
Fig.3 Dendrogram of the 36 oat varieties based on SCoT markers using UPGMA method
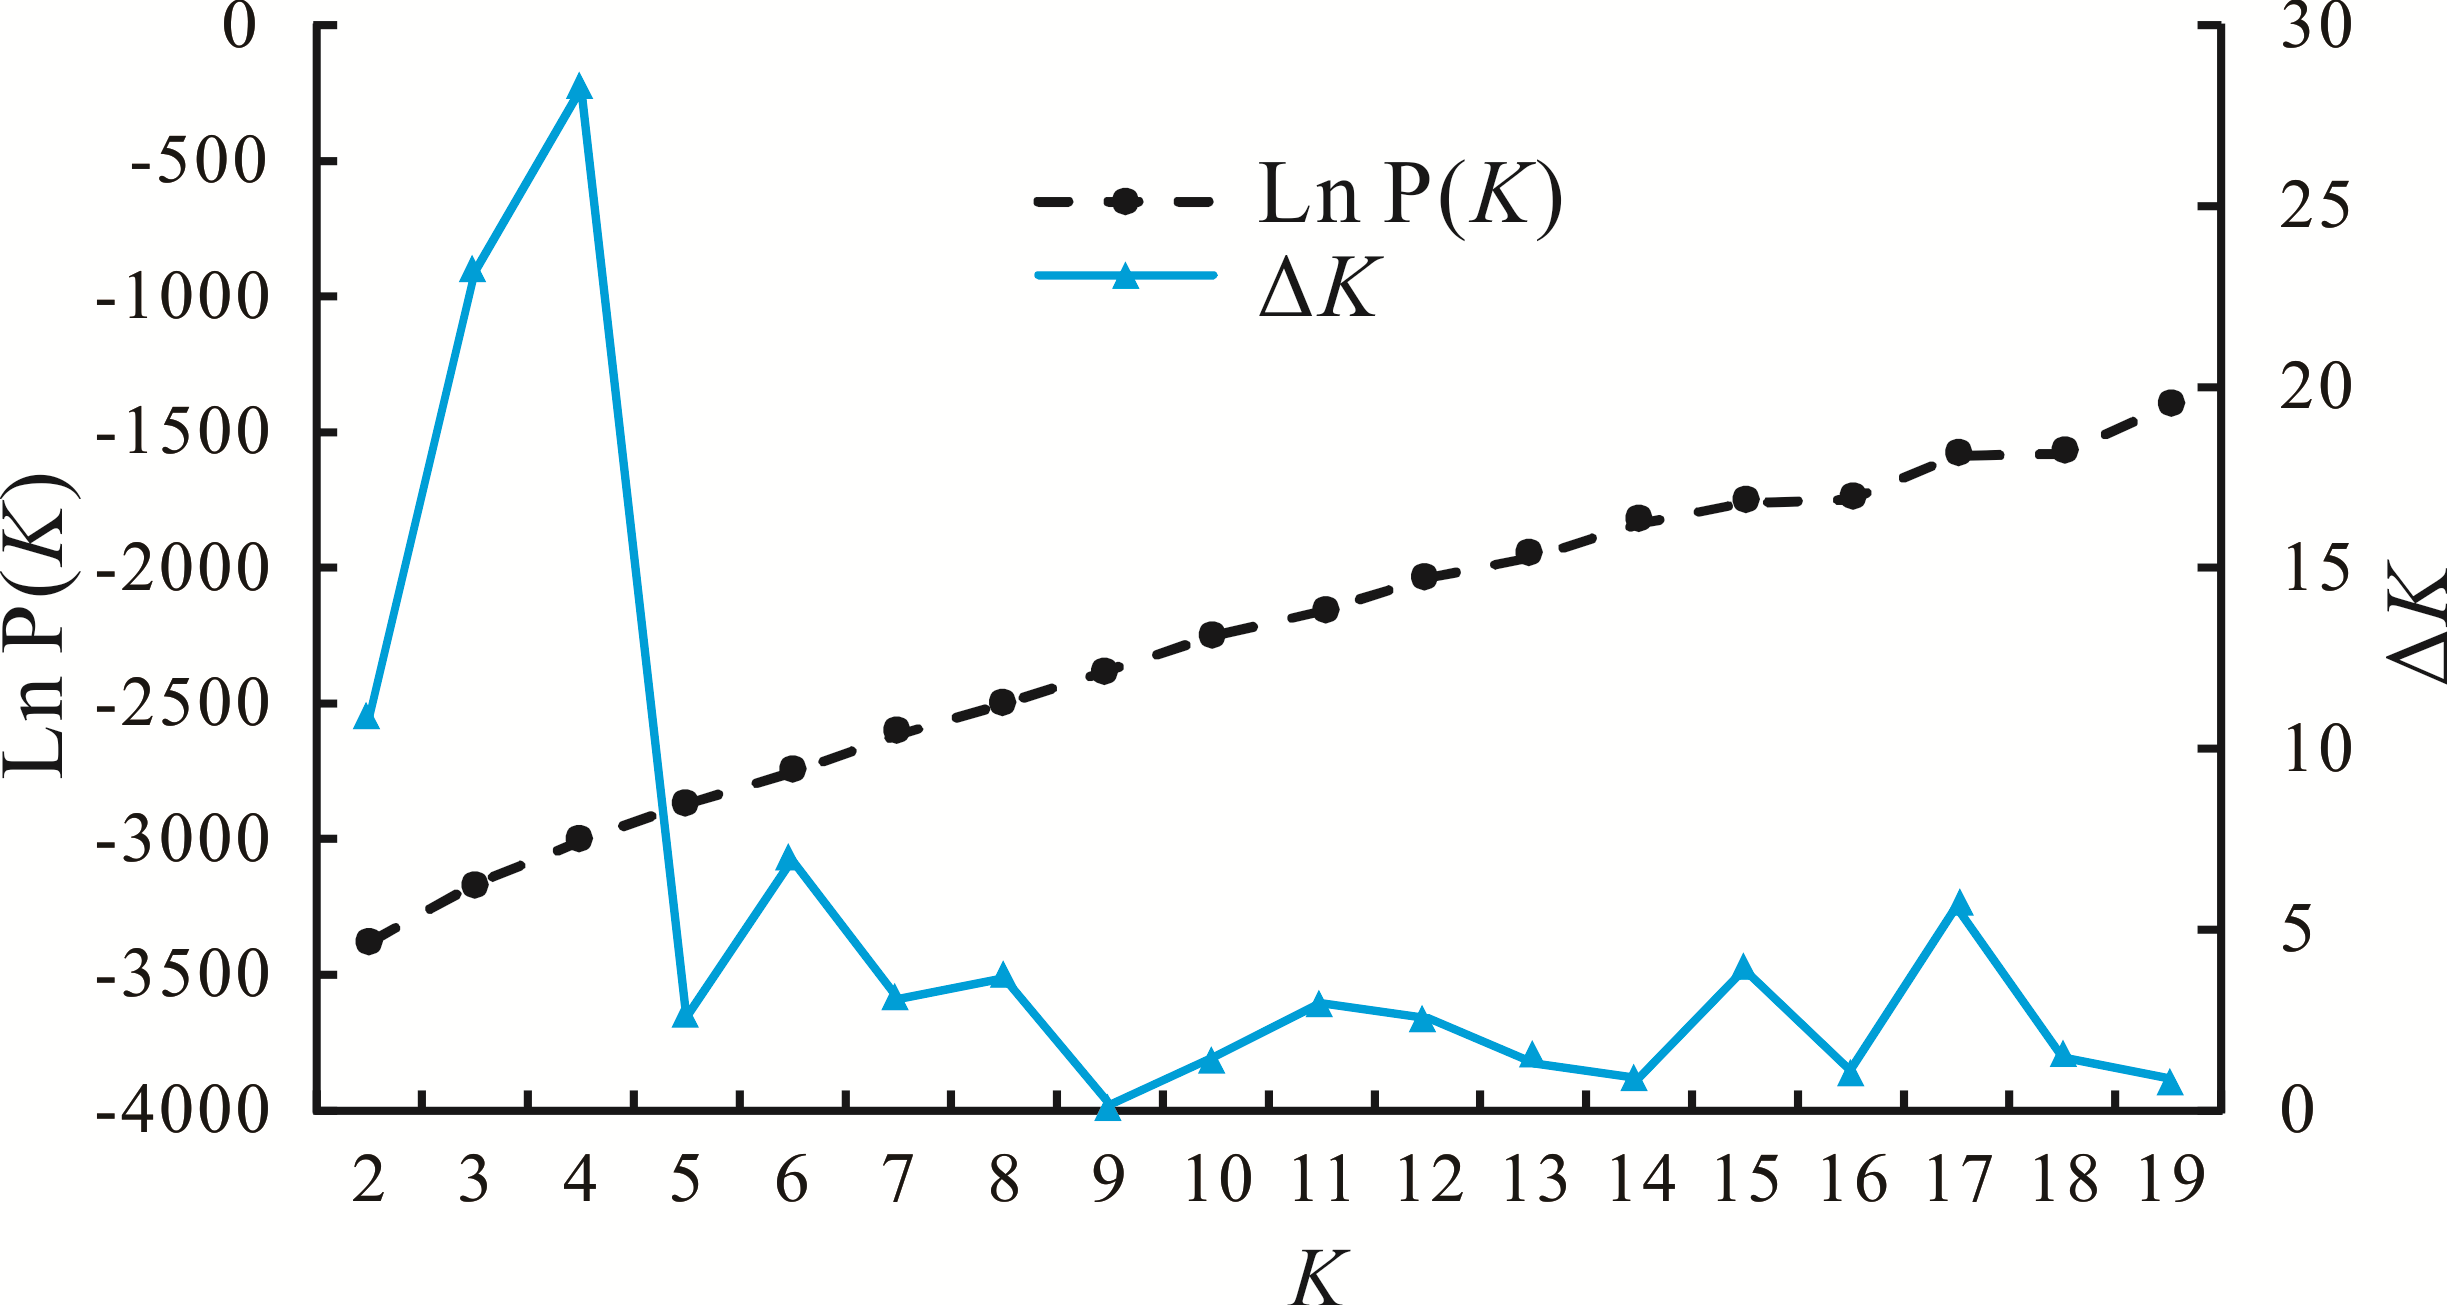
图4 基于Structure分析的K值曲线
Fig.4 Curve diagram of K value based on Structure
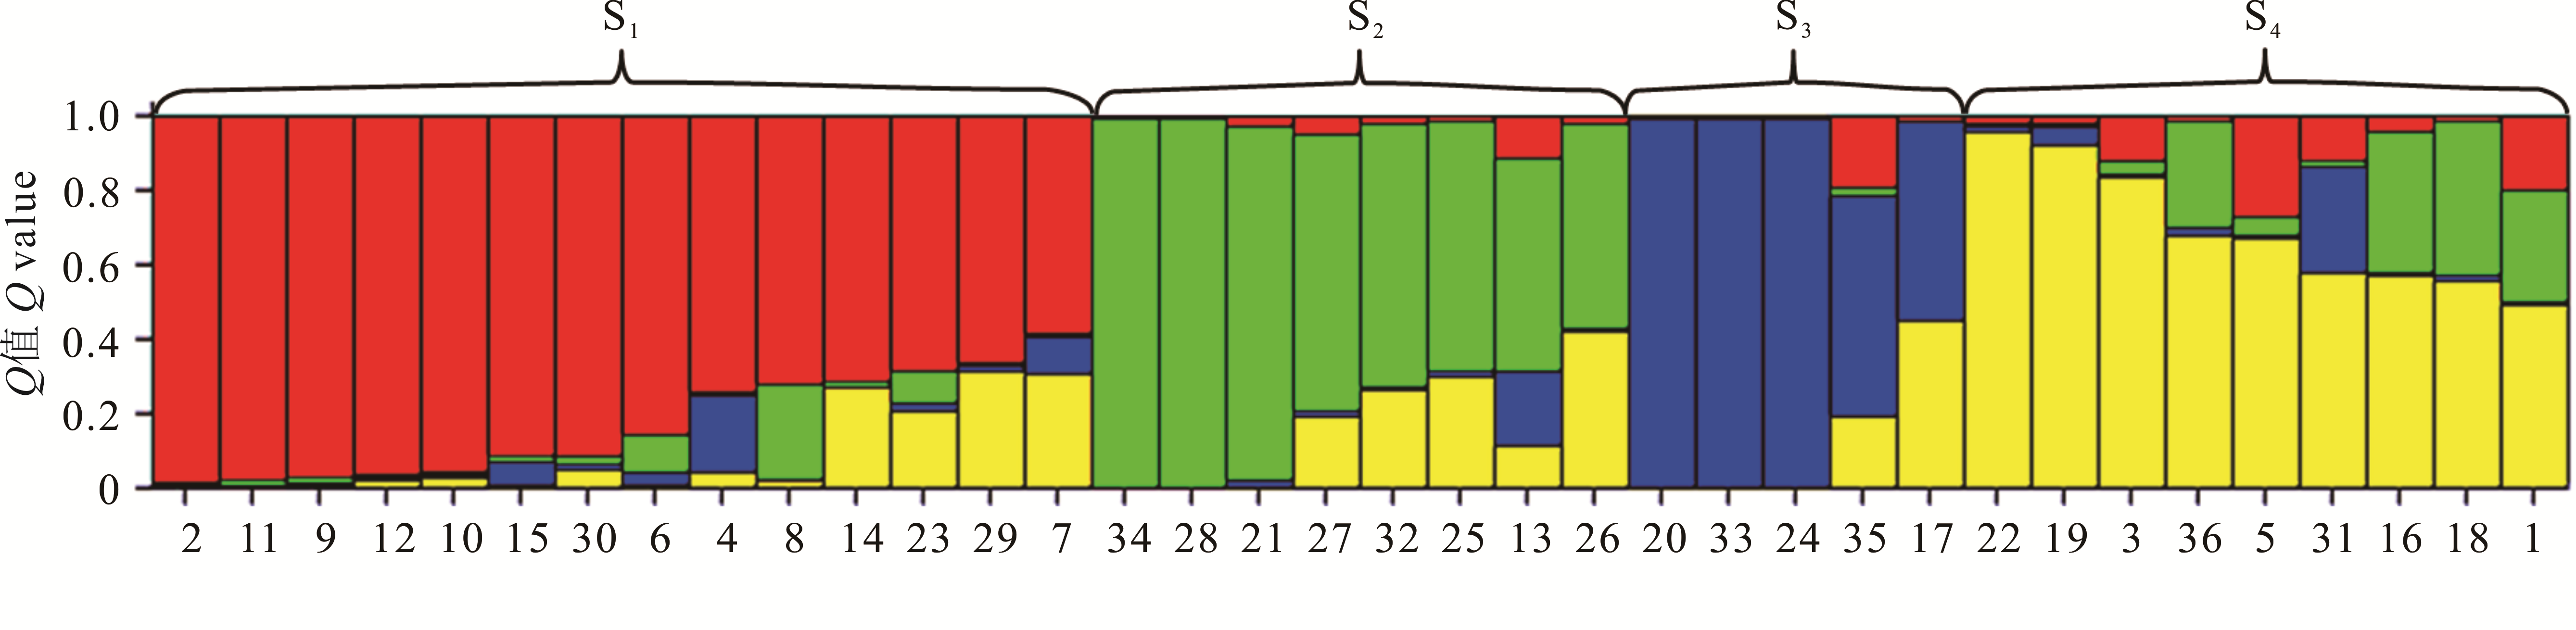
图 5 36份燕麦材料群体结构分析
Fig.5 Population genetic structure of 36 oat varieties
| 1 | Zhao G Q, Mu P, Wei L M. Research progress of feed oats. Acta Prataculturae Sinica, 2007, 69(4): 116-125. |
| 赵桂琴, 慕平, 魏黎明. 饲用燕麦研究进展. 草业学报, 2007, 69(4): 116-125. | |
| 2 | Ren C Z, Hu Y G. China oats. Beijing: China Agricultural Press, 2013: 11. |
| 任长忠, 胡跃高. 中国燕麦学. 北京: 中国农业出版社, 2013: 11. | |
| 3 | Sun J P, Dong K H, Kuai X Y, et al. Comparison of productivity and feeding value of introduced oat varieties in the agro-pasture ecotone of northern Shanxi. Acta Prataculturae Sinica, 2017, 26(11): 222-230. |
| 孙建平, 董宽虎, 蒯晓妍, 等. 晋北农牧交错区引进燕麦品种生产性能及饲用价值比较. 草业学报, 2017, 26(11): 222-230. | |
| 4 | Zhang G Y, Ma H P, Shao X M, et al. A comparative study of yield and nutritive value of nine imported oat varieties in the valley region of Tibet, China. Acta Prataculturae Sinica, 2019, 28(5): 121-131. |
| 张光雨, 马和平, 邵小明, 等. 西藏河谷区9个引进燕麦品种的生产性能和营养品质比较研究. 草业学报, 2019, 28(5): 121-131. | |
| 5 | Rocquigny P J, Entz M H, Gentile RM, et al. Yield physiology of a semidwarf and tall oat cultivar. Crop Science, 2004, 44(6): 2116-2122. |
| 6 | Zhou Q P, Gou X L, Tian L H, et al. Performances of early and late maturing oat varieties in cold regions. Chinese Science Bulletin, 2018, 63(17): 1722-1730. |
| 周青平, 苟小林, 田莉华, 等. 寒冷区早晚熟燕麦品种的生产性能分析. 科学通报, 2018, 63(17): 1722-1730. | |
| 7 | Liu G, Zhao G Q. Application of the grey systematic theory to integrated evaluation of lodging resistance in oat. Pratacultural Science, 2006, 23(10): 23-27. |
| 刘刚, 赵桂琴. 灰色系统理论在燕麦抗倒伏综合评价中的应用. 草业科学, 2006, 23(10): 23-27. | |
| 8 | Liu F Q, Liu J L, Zhu R F, et al. Physiological responses and tolerance of four oat varieties to salt stress. Acta Prataculturae Sinica, 2015, 24(1): 183-189. |
| 刘凤歧, 刘杰淋, 朱瑞芬, 等. 4种燕麦对NaCl胁迫的生理响应及耐盐性评价. 草业学报, 2015, 24(1): 183-189. | |
| 9 | He X, Bjørnstad Å. Diversity of North European oat analyzed by SSR, AFLP and DArT markers. Theoretical and Applied Genetics, 2012, 125(1): 57-70. |
| 10 | Chen S Y, Zhou Q P, Huang L K, et al. The genetic diversity and phylogenetic analysis of 15 forage oat varieties. Seed, 2019, 38(2): 16-19. |
| 陈仕勇, 周青平, 黄琳凯, 等. 15个饲用燕麦品种的遗传变异及亲缘关系分析. 种子, 2019, 38(2): 16-19. | |
| 11 | Liu H, Mu P, Zhao G Q. A study on genetic diversity of Avena germplasm resources detected by ISSR. Acta Prataculturae Sinica, 2012, 21(4): 116-124. |
| 刘欢, 慕平, 赵桂琴. 燕麦种质资源遗传多样性ISSR研究. 草业学报, 2012, 21(4): 116-124. | |
| 12 | Fu Y B, Peterson G W, Williams D, et al. Patterns of AFLP variation in a core subset of cultivated hexaploid oat germplasm. Theoretical and Applied Genetics, 2005, 111(3): 530-539. |
| 13 | Bai X L, Liu Y C, Sheng G L, et al. Assessment of genetic diversity of 35 hulled oat accessions using SSR and SRAP makers. Inner Mongolia Agricultural Science and Technology, 2015, 43(4): 6-11. |
| 白晓雷, 刘艳春, 生国利, 等. 35份皮燕麦种质遗传多样性的SSR和SRAP分析. 内蒙古农业科技, 2015, 43(4): 6-11. | |
| 14 | Collard B C Y, Mackill D J. Start codon targeted (SCoT) polymorphism: A simple, novel DNA marker technique for generating gene-targeted markers in plants. Plant Molecular Biology Reporter, 2009, 27(1): 86-93. |
| 15 | He Q Y, Wang W B, Yang H Y, et al. Optimization of SCoT reaction system and genetic diversity of different fall dormancy alfalfa. Acta Prataculturae Sinica, 2012, 21(2): 133-140. |
| 何庆元, 王吴斌, 杨红燕, 等. 利用SCoT标记分析不同秋眠型苜蓿的遗传多样性. 草业学报, 2012, 21(2): 133-140. | |
| 16 | Jiang L F, Zhang X Q, Huang L K, et al. Analysis of genetic diversity in a cocksfoot (Dactylis glomerata) variety using SCoT markers. Acta Prataculturae Sinica, 2014, 23(1): 229-238. |
| 蒋林峰, 张新全, 黄琳凯, 等. 鸭茅品种的SCoT遗传变异分析. 草业学报, 2014, 23(1): 229-238. | |
| 17 | Luo C, He X, Chen H, et al. Analysis of diversity and relationships among mango cultivars using start codon targeted (SCoT) markers. Biochemical Systematics and Ecology, 2010, 38(6): 1176-1184. |
| 18 | Liu X L, Ma L, Chen X K, et al. Establishment of DNA fingerprint ID in sugarcane cultivars in Yunnan, China. Acta Agronomica Sinica, 2010, 36(2): 202-210. |
| 刘新龙, 马丽, 陈学宽, 等. 云南甘蔗自育品种DNA指纹身份证构建. 作物学报, 2010, 36(2): 202-210. | |
| 19 | Liu L H, Wang L X, Zhao C P, et al. Genetic diversity and alterations of population structure in restorers of dual cross-line hybrid wheat with thermo-photoperiod sensitive male sterile. Chinese Journal of Biochemistry and Molecular Biology, 2009, 25(9): 867-875. |
| 刘丽华, 王立新, 赵昌平, 等. 光温敏二系杂交小麦恢复系遗传多样性和群体结构分析. 中国生物化学与分子生物学报, 2009, 25(9): 867-875. | |
| 20 | Li Y, Wang J K, Qiu L J, et al. Crop molecular breeding in China: Current status and perspectives. Acta Agronomica Sinica, 2010, 36(9): 1425-1430. |
| 黎裕, 王建康, 邱丽娟, 等. 中国作物分子育种现状与发展前景. 作物学报, 2010, 36(9): 1425-1430. | |
| 21 | Xue D D, Guo H L, Zheng Y Q, et al. Hybrid identification of progenies of Zoysia crosses by SRAP marker. Acta Prataculturae Sinica, 2009, 18(1): 72-79. |
| 薛丹丹, 郭海林, 郑轶琦, 等. 结缕草属植物杂交后代杂种真实性鉴定—SRAP分子标记. 草业学报, 2009, 18(1): 72-79. | |
| 22 | Liu H, Mu P, Zhao G Q. Genetic diversity in Avena based on AFLP analysis. Acta Prataculturae Sinica, 2008, 17(6): 121-127. |
| 刘欢, 慕平, 赵桂琴. 基于AFLP的燕麦遗传多样性研究. 草业学报, 2008, 17(6): 121-127. | |
| 23 | Li C D, Rossnagel B G, Scoles G J. The development of oat microsatellite markers and their use in identifying relationships among Avena species and oat cultivars. Theoretical and Applied Genetics, 2000, 101(8): 1259-1268. |
| 24 | Xiong F Q, Jiang Q, Zhong R C, et al. Application of SCoT molecular marker in genus Arachis. Acta Agronomica Sinica, 2010, 36(12): 2055-2061. |
| 熊发前, 蒋菁, 钟瑞春, 等. 目标起始密码子多态性(SCoT)分子标记技术在花生属中的应用. 作物学报, 2010, 36(12): 2055-2061. | |
| 25 | Han G H, Xiang S Q, Wang W X, et al. Establishment and application of SCoT molecular marker system for Citrus. Acta Horticulturae Sinica, 2011, 38(7): 1243-1250. |
| 韩国辉, 向素琼, 汪卫星, 等. 柑橘SCoT分子标记技术体系的建立及其在遗传分析中的应用. 园艺学报, 2011, 38(7): 1243-1250. | |
| 26 | Jiang L F, Zhang X Q, Huang L K, et al. Construction of DNA fingerprinting of dominant orchardgrass (Dactylis glomerata) varieties of China. Journal of Plant Genetic Resources, 2014, 15(3): 604-614. |
| 蒋林峰, 张新全, 黄琳凯, 等. 中国鸭茅主栽品种DNA指纹图谱构建. 植物遗传资源学报, 2014, 15(3): 604-614. | |
| 27 | Qi B J, Liu J H, Gao J L, et al. Gliadin genetic diversity of oat germplasms. Journal of Triticeae Crops, 2010, 30(3): 427-430, 448. |
| 齐冰洁, 刘景辉, 高聚林, 等. 燕麦种质资源醇溶蛋白遗传多样性研究. 麦类作物学报, 2010, 30(3): 427-430, 448. | |
| 28 | Shen G W, Li J S, Ren C Z, et al. Genetic diversity and population structure analysis of oat germplasm from China and Canada. Journal of Triticeae Crops, 2010, 30(4): 617-624. |
| 沈国伟, 李建设, 任长忠, 等. 中加燕麦种质的遗传多样性和群体结构分析. 麦类作物学报, 2010, 30(4): 617-624. |
| [1] | 袁英良, 唐丹, 鲁英, 冉桂霞, 郭艳芹. 吉林地区麦后复种饲用油菜与燕麦混播效应研究[J]. 草业学报, 2021, 30(7): 167-178. |
| [2] | 聂秀美, 慕平, 赵桂琴, 何海鹏, 吴文斌, 蔺豆豆, 苏伟娟, 张丽睿. 贮藏年限对裸燕麦种带真菌和真菌毒素的影响[J]. 草业学报, 2021, 30(6): 106-120. |
| [3] | 高鹏, 魏江铭, 李瑶, 张丽红, 赵祥, 杜利霞, 韩伟. 山西省大同市早播饲用燕麦叶部真菌病害病原鉴定及影响因素分析[J]. 草业学报, 2021, 30(6): 82-93. |
| [4] | 刘凯强, 刘文辉, 贾志锋, 梁国玲, 马祥. 干旱胁迫对‘青燕1号’燕麦产量及干物质积累与分配的影响[J]. 草业学报, 2021, 30(3): 177-188. |
| [5] | 刘建新, 刘瑞瑞, 贾海燕, 卜婷, 李娜. NaHS引发提高裸燕麦种子活力的生理机制[J]. 草业学报, 2021, 30(2): 135-142. |
| [6] | 王苗苗, 周向睿, 梁国玲, 赵桂琴, 焦润安, 柴继宽, 高雪梅, 李娟宁. 5份燕麦材料苗期耐盐性综合评价[J]. 草业学报, 2020, 29(8): 143-154. |
| [7] | 马千虎, 张学梅, 王自奎, 杨惠敏. 基于APSIM模型的高寒地区燕麦灌溉制度优化[J]. 草业学报, 2020, 29(7): 1-10. |
| [8] | 雷雄, 游明鸿, 白史且, 陈丽丽, 邓培华, 熊毅, 熊艳丽, 余青青, 马啸, 杨建, 张昌兵. 川西北高原50份燕麦种质农艺性状遗传多样性分析及综合评价[J]. 草业学报, 2020, 29(7): 131-142. |
| [9] | 聂秀美, 赵桂琴, 孙浩洋, 柴继宽, 兰晓君, 周恒, 黎蓉, 琚泽亮, 焦润安, 孙雷雷. 甘肃省燕麦主产区叶斑病调查及病原鉴定[J]. 草业学报, 2020, 29(4): 157-167. |
| [10] | 肖燕子, 徐丽君, 辛晓平, 乌仁其其格null, 孙林, 姜超. 呼伦贝尔地区不同燕麦品种的营养价值及发酵品质评价研究[J]. 草业学报, 2020, 29(12): 171-179. |
| [11] | 杨晶, 刘文辉, 梁国玲, 贾志锋, 刘凯强, 张燕, 吴瑞, 杨钰洁. 高寒地区不同燕麦品系抗倒伏相关性状分析[J]. 草业学报, 2020, 29(12): 50-60. |
| [12] | 刘建新, 欧晓彬, 王金成, 刘瑞瑞, 贾海燕. 镉胁迫下裸燕麦幼苗对外源H2O2的生理响应[J]. 草业学报, 2020, 29(1): 125-134. |
| [13] | 琚泽亮, 赵桂琴, 柴继宽, 贾志峰, 梁国玲. 不同燕麦品种在甘肃中部的营养价值及青贮发酵品质综合评价[J]. 草业学报, 2019, 28(9): 77-86. |
| [14] | 张霞, 李妙善, 周恩光, 王虎成. 西北地区4种优质饲草的肉牛体外瘤胃发酵性能研究[J]. 草业学报, 2019, 28(9): 135-145. |
| [15] | 梁婷玉, 郞侠, 吴建平, 王彩莲, 刘立山, 张瑞, 韦胜. 燕麦与苜蓿不同比例组合对驴盲肠体外发酵的影响[J]. 草业学报, 2019, 28(6): 185-195. |
| 阅读次数 | ||||||
|
全文 |
|
|||||
|
摘要 |
|
|||||