

ISSN 1004-5759 CN 62-1105/S
草业学报 ›› 2021, Vol. 30 ›› Issue (11): 1-12.DOI: 10.11686/cyxb2020569
• 研究论文 •
张殿岱1( ), 王雪梅1,2(), 昝梅1,2
收稿日期:2020-12-16
修回日期:2021-05-10
出版日期:2021-10-19
发布日期:2021-10-19
通讯作者:
王雪梅
作者简介:Corresponding author. E-mail: wangxm_1225@sina.com基金资助:
Dian-dai ZHANG1(), Xue-mei WANG1,2(), Mei ZAN1,2
Received:2020-12-16
Revised:2021-05-10
Online:2021-10-19
Published:2021-10-19
Contact:
Xue-mei WANG
摘要:
干旱区绿洲植被地上生物量估算研究可为绿洲生态系统稳定性评价与区域碳储量估算提供重要依据。以渭干河-库车河三角洲绿洲为研究区,利用ENVI 5.3软件对Landsat 8 OLI 影像数据进行预处理,提取反映植被地上生物量信息的植被指数和波段因子,并结合样地实测数据,采用常规统计模型、多元逐步回归和偏最小二乘回归方法建立研究区植被地上生物量最优估测模型,从而揭示该绿洲植被地上生物量的空间分布特征。结果表明:1)所选的20个遥感因子与实测植被地上生物量呈极显著正相关关系,相关系数为0.5~0.7(P<0.01)。2)乔木与灌木地上生物量最优估测模型均为多元逐步回归模型,草本与农作物地上生物量的估测模型以偏最小二乘回归模型为最优,模型验证决定系数均在0.6以上,均方根误差和平均绝对误差均较小。3)研究区植被地上生物量主要在280~1450 g·m-2 分布,面积约为6973.82 km2,低水平地上生物量(ABG<65 g·m-2)分布区域约占研究区总面积的15.02%。地上生物量由高到低依次为:农作物>乔木>灌木>草本。根据不同的植被类型,基于地物光谱特征构建的遥感估测模型可准确估算干旱区绿洲植被地上生物量,并对其空间分布特征进行遥感定量反演。
张殿岱, 王雪梅, 昝梅. 基于Landsat 8 OLI影像的渭-库绿洲植被地上生物量估算[J]. 草业学报, 2021, 30(11): 1-12.
Dian-dai ZHANG, Xue-mei WANG, Mei ZAN. Estimation of vegetation aboveground biomass in the Wei-Ku Oasis based on Landsat 8 OLI images[J]. Acta Prataculturae Sinica, 2021, 30(11): 1-12.

图1 研究区采样点分布
Fig.1 Distribution of sampling points in study area
植被指数 Vegetation index | 计算公式 Calculation formula |
|---|---|
| 归一化植被指数 NDVI | |
| 差值植被指数 DVI | |
| 比值植被指数 RVI | |
| 土壤调节植被指数 SAVI | |
| 修改型土壤调节植被指数MSAVI | |
| 增强型植被指数 EVI | |
| 大气阻抗植被指数 ARVI |
表1 植被指数计算公式
Table 1 Calculation formulas of vegetation index
植被指数 Vegetation index | 计算公式 Calculation formula |
|---|---|
| 归一化植被指数 NDVI | |
| 差值植被指数 DVI | |
| 比值植被指数 RVI | |
| 土壤调节植被指数 SAVI | |
| 修改型土壤调节植被指数MSAVI | |
| 增强型植被指数 EVI | |
| 大气阻抗植被指数 ARVI |
| 波段组合Band combination | 计算公式Calculation formula |
|---|---|
| 波段值和波段倒数Band value and band reciprocal | B1,B2,B3,B4,B5,B6,B7 1/B2,1/B3,1/B4,1/B5,1/B6,1/B7 |
| 2个波段比值Ratio of 2 bands | B23=B2/B3,B24=B2/B4,B25=B2/B5 B34=B3/B4,B35=B3/B5,B45=B4/B5 |
| 3个波段比值Ratio of 3 bands | B234=(B2+B3)/B4, B235=(B2+B3)/B5, B243=(B2+B4)/B3 B245=(B2+B4)/B5, B253=(B2+B5)/B3, B254=(B2+B5)/B4 B342=(B3+B4)/B2, B345=(B3+B4)/B5, B352=(B3+B5)/B2 B354=(B3+B5)/B4, B452=(B4+B5)/B2, B453=(B4+B5)/B3 |
| 4个波段比值Ratio of 4 bands | B2345=(B2+B3)/(B4+B5),B2435=(B2+B4)/(B3+B5) B2534=(B2+B5)/(B3+B4),B3425=(B3+B4)/(B2+B5) B234/5=(B2+B3+B4)/B5,B345/2=(B3+B4+B5)/B2 |
表2 Landsat 8波段组合计算公式
Table 2 Calculation formulas of Landsat 8 band combination
| 波段组合Band combination | 计算公式Calculation formula |
|---|---|
| 波段值和波段倒数Band value and band reciprocal | B1,B2,B3,B4,B5,B6,B7 1/B2,1/B3,1/B4,1/B5,1/B6,1/B7 |
| 2个波段比值Ratio of 2 bands | B23=B2/B3,B24=B2/B4,B25=B2/B5 B34=B3/B4,B35=B3/B5,B45=B4/B5 |
| 3个波段比值Ratio of 3 bands | B234=(B2+B3)/B4, B235=(B2+B3)/B5, B243=(B2+B4)/B3 B245=(B2+B4)/B5, B253=(B2+B5)/B3, B254=(B2+B5)/B4 B342=(B3+B4)/B2, B345=(B3+B4)/B5, B352=(B3+B5)/B2 B354=(B3+B5)/B4, B452=(B4+B5)/B2, B453=(B4+B5)/B3 |
| 4个波段比值Ratio of 4 bands | B2345=(B2+B3)/(B4+B5),B2435=(B2+B4)/(B3+B5) B2534=(B2+B5)/(B3+B4),B3425=(B3+B4)/(B2+B5) B234/5=(B2+B3+B4)/B5,B345/2=(B3+B4+B5)/B2 |
序号 Serial number | 常规统计模型函数 Function of conventional statistical models | 表达式 Expression |
|---|---|---|
| 1 | 线性函数 Linear function | |
| 2 | 幂函数 Power function | |
| 3 | 逆函数 Inverse function | |
| 4 | 对数函数 Logarithmic function | |
| 5 | 指数函数 Exponential function | |
| 6 | S型曲线函数 S-curve function | |
| 7 | 二次项函数 Quadratic term function | |
| 8 | 三次项函数 Cubic term function |
表3 常规统计模型的函数表达式
Table 3 Function expressions conventional statistical model
序号 Serial number | 常规统计模型函数 Function of conventional statistical models | 表达式 Expression |
|---|---|---|
| 1 | 线性函数 Linear function | |
| 2 | 幂函数 Power function | |
| 3 | 逆函数 Inverse function | |
| 4 | 对数函数 Logarithmic function | |
| 5 | 指数函数 Exponential function | |
| 6 | S型曲线函数 S-curve function | |
| 7 | 二次项函数 Quadratic term function | |
| 8 | 三次项函数 Cubic term function |
序号 Serial number | 变量 Variables | 乔木 Arbors | 灌木 Shrubs | 草本 Herbs | 农作物 Crops | 序号 Serial number | 变量 Variables | 乔木 Arbors | 灌木 Shrubs | 草本 Herbs | 农作物 Crops |
|---|---|---|---|---|---|---|---|---|---|---|---|
| 1 | NDVI | 0.716** | 0.720** | 0.711** | 0.602** | 11 | B354 | 0.660** | 0.617** | 0.628** | 0.673** |
| 2 | RVI | 0.701** | 0.716** | 0.707** | 0.675** | 12 | B452 | 0.657** | 0.519** | - | 0.669** |
| 3 | SAVI | 0.716** | 0.720** | 0.711** | 0.602** | 13 | B453 | 0.737** | 0.601** | - | 0.686** |
| 4 | ARVI | 0.662** | 0.543** | - | 0.589** | 14 | B345/2 | 0.634** | 0.497** | - | 0.666** |
| 5 | DVI | 0.730** | 0.670** | 0.609** | 0.488** | 15 | B2534 | 0.711** | 0.660** | 0.598** | 0.679** |
| 6 | EVI | 0.634** | 0.567** | 0.555** | 0.542** | 16 | 1/B3 | - | 0.587** | - | 0.756** |
| 7 | 1/B2 | 0.590** | 0.596** | 0.536** | 0.718** | 17 | 1/B4 | - | 0.531** | - | 0.742** |
| 8 | B253 | 0.755** | 0.701** | 0.588** | 0.682** | 18 | 1/B6 | - | - | - | 0.572** |
| 9 | B254 | 0.650** | 0.508** | - | 0.672** | 19 | 1/B7 | - | - | - | 0.669** |
| 10 | B352 | 0.677** | 0.571** | - | 0.670** | 20 | B34 | - | - | - | 0.557** |
表4 遥感特征因子与植被地上生物量相关性分析
Table 4 Correlation analysis of remote sensing characteristic factors and aboveground biomass of vegetation
序号 Serial number | 变量 Variables | 乔木 Arbors | 灌木 Shrubs | 草本 Herbs | 农作物 Crops | 序号 Serial number | 变量 Variables | 乔木 Arbors | 灌木 Shrubs | 草本 Herbs | 农作物 Crops |
|---|---|---|---|---|---|---|---|---|---|---|---|
| 1 | NDVI | 0.716** | 0.720** | 0.711** | 0.602** | 11 | B354 | 0.660** | 0.617** | 0.628** | 0.673** |
| 2 | RVI | 0.701** | 0.716** | 0.707** | 0.675** | 12 | B452 | 0.657** | 0.519** | - | 0.669** |
| 3 | SAVI | 0.716** | 0.720** | 0.711** | 0.602** | 13 | B453 | 0.737** | 0.601** | - | 0.686** |
| 4 | ARVI | 0.662** | 0.543** | - | 0.589** | 14 | B345/2 | 0.634** | 0.497** | - | 0.666** |
| 5 | DVI | 0.730** | 0.670** | 0.609** | 0.488** | 15 | B2534 | 0.711** | 0.660** | 0.598** | 0.679** |
| 6 | EVI | 0.634** | 0.567** | 0.555** | 0.542** | 16 | 1/B3 | - | 0.587** | - | 0.756** |
| 7 | 1/B2 | 0.590** | 0.596** | 0.536** | 0.718** | 17 | 1/B4 | - | 0.531** | - | 0.742** |
| 8 | B253 | 0.755** | 0.701** | 0.588** | 0.682** | 18 | 1/B6 | - | - | - | 0.572** |
| 9 | B254 | 0.650** | 0.508** | - | 0.672** | 19 | 1/B7 | - | - | - | 0.669** |
| 10 | B352 | 0.677** | 0.571** | - | 0.670** | 20 | B34 | - | - | - | 0.557** |
模型 Model | 表达式 Expression | 建模Modeling | 验证Verification | P | ||||
|---|---|---|---|---|---|---|---|---|
| R2 | RMSE | MAE | R2 | RMSE | MAE | |||
| 二次项Quadratic term | 0.686 | 4.517 | 0.067 | 0.893 | 9.521 | 0.118 | 0.000 | |
| 多元逐步回归MSR | 0.607 | 5.050 | 0.066 | 0.812 | 8.176 | 0.095 | 0.000 | |
| 偏最小二乘回归PLSR | 0.713 | 4.589 | 0.069 | 0.745 | 7.753 | 0.107 | 0.000 | |
表 5 乔木地上生物量不同估测模型效果评价
Table 5 Evaluation of different estimation models for aboveground biomass of arbors
模型 Model | 表达式 Expression | 建模Modeling | 验证Verification | P | ||||
|---|---|---|---|---|---|---|---|---|
| R2 | RMSE | MAE | R2 | RMSE | MAE | |||
| 二次项Quadratic term | 0.686 | 4.517 | 0.067 | 0.893 | 9.521 | 0.118 | 0.000 | |
| 多元逐步回归MSR | 0.607 | 5.050 | 0.066 | 0.812 | 8.176 | 0.095 | 0.000 | |
| 偏最小二乘回归PLSR | 0.713 | 4.589 | 0.069 | 0.745 | 7.753 | 0.107 | 0.000 | |
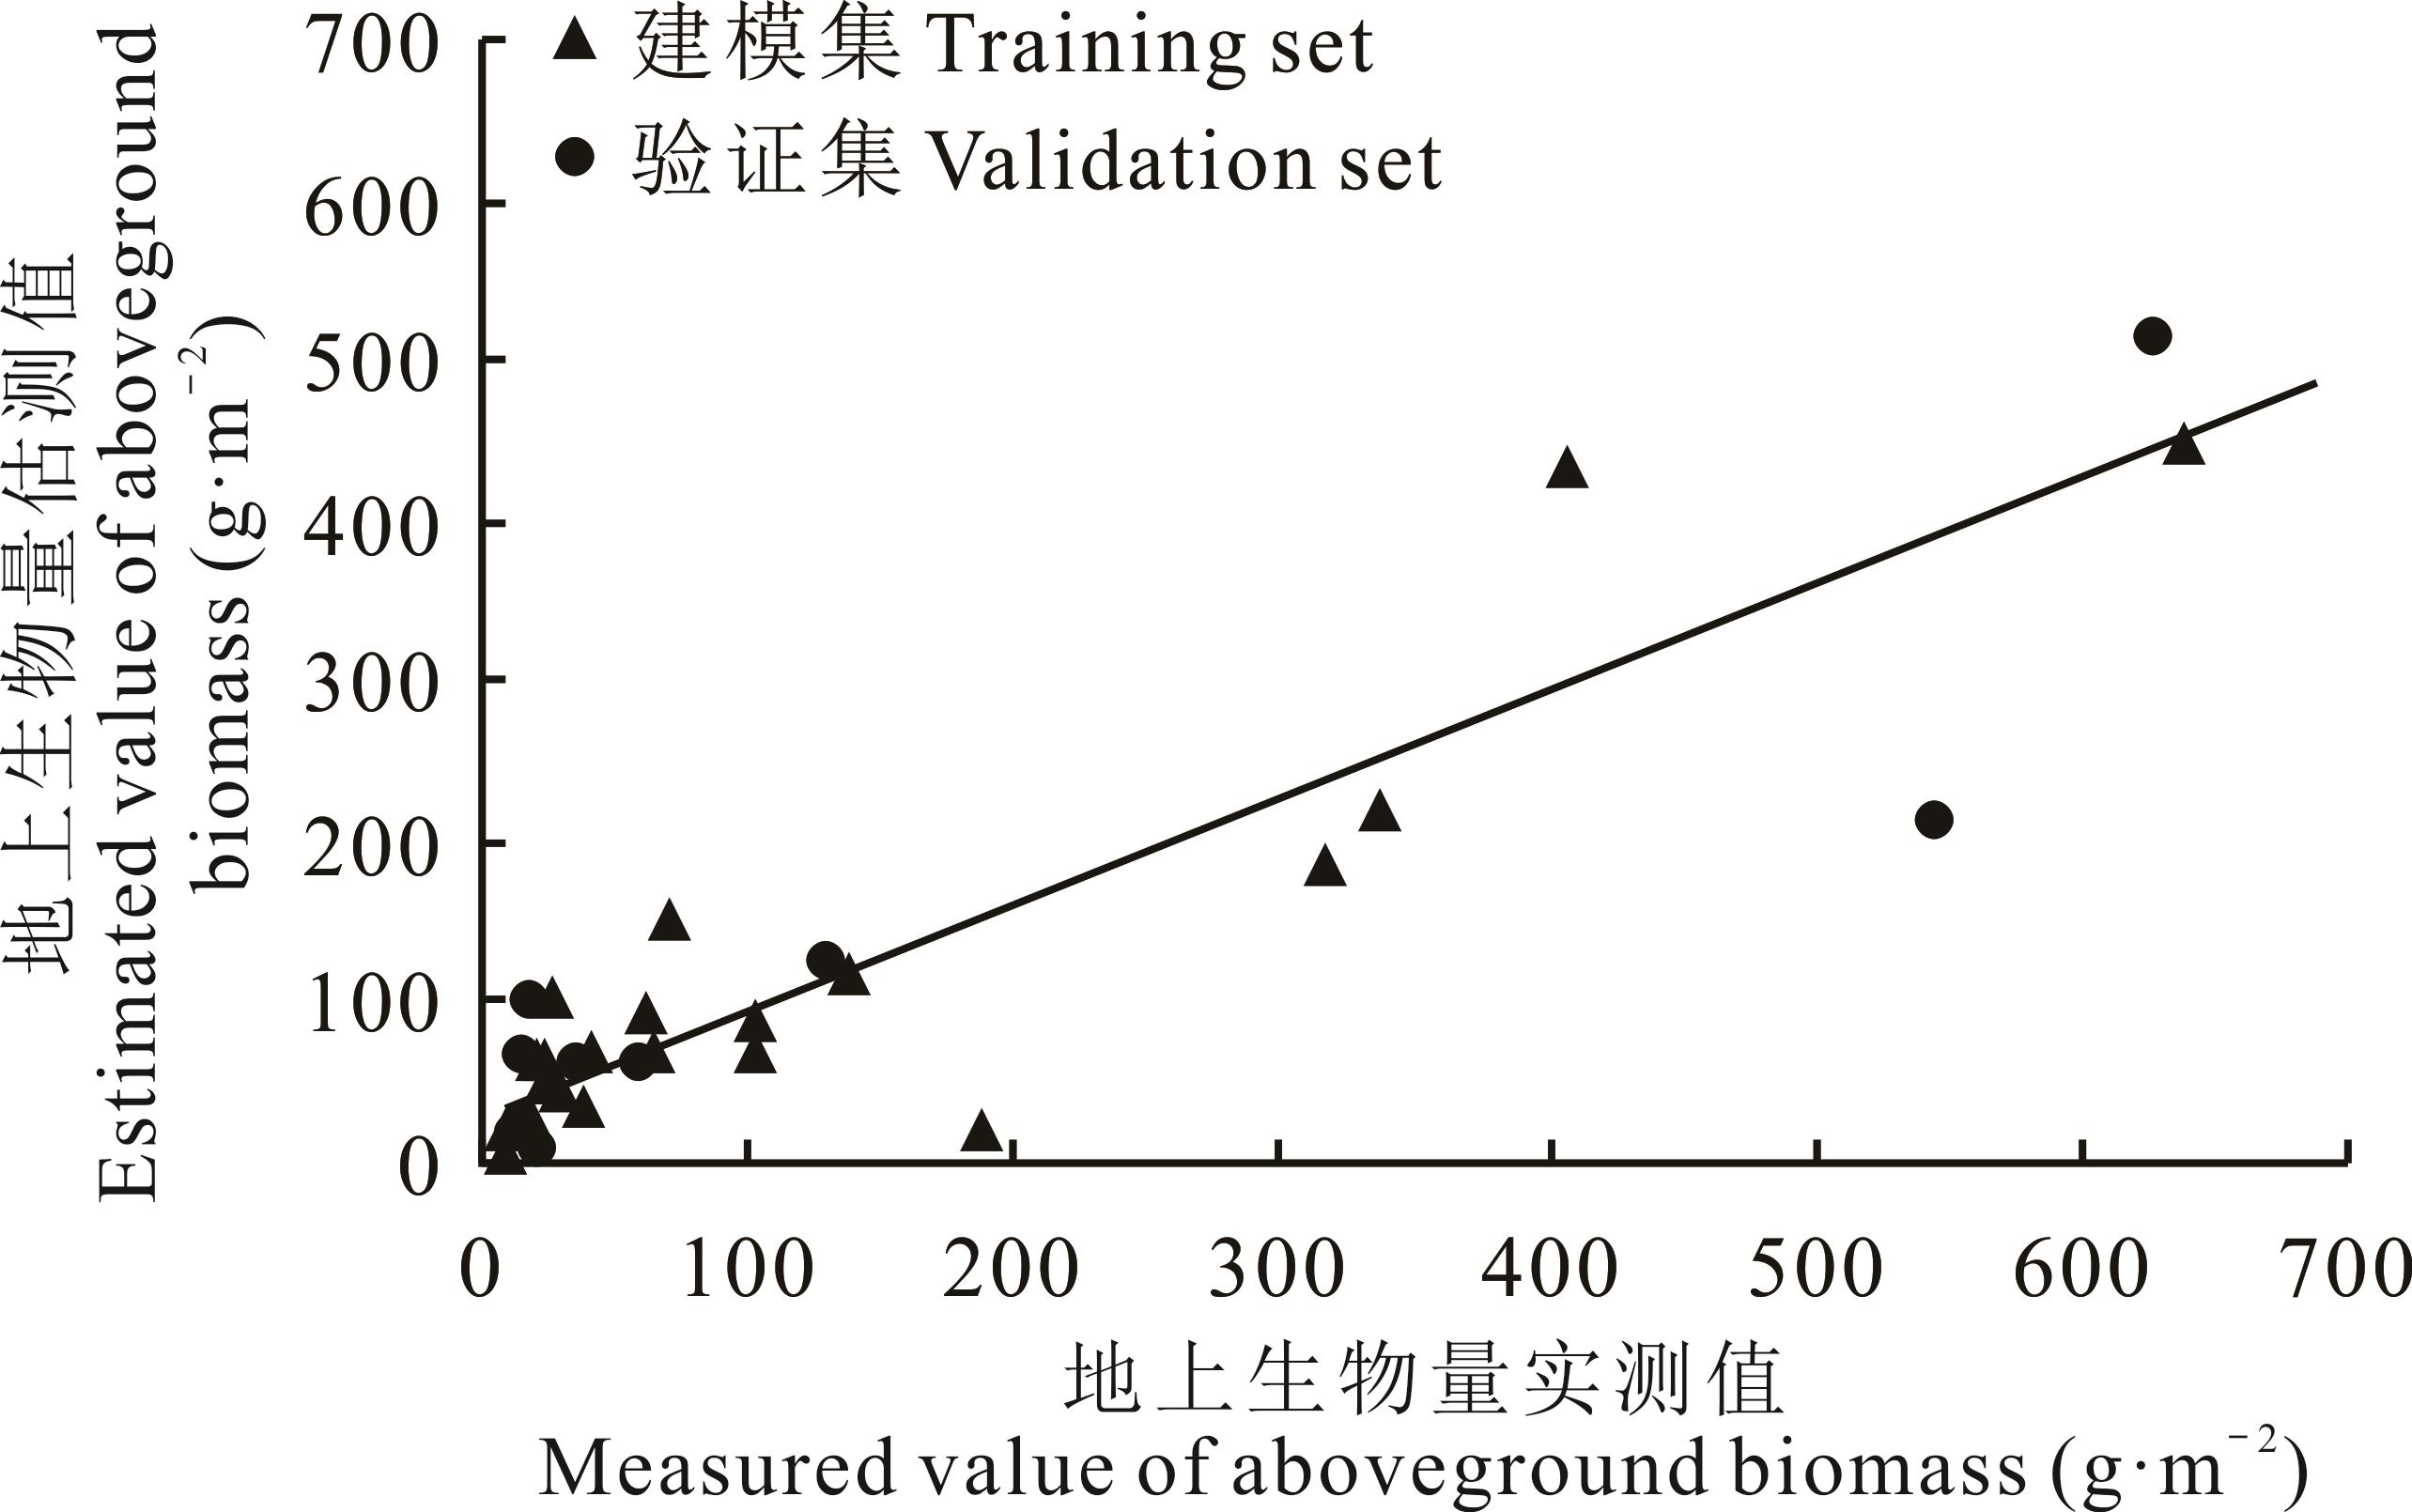
图2 研究区乔木最优模型验证
Fig.2 Verification map of arbors optimal model in the study area
模型 Model | 表达式 Expression | 建模Modeling | 验证Verification | P | ||||
|---|---|---|---|---|---|---|---|---|
| R2 | RMSE | MAE | R2 | RMSE | MAE | |||
| S型曲线S-curve | 0.560 | 0.832 | 0.689 | 0.394 | 0.826 | 0.642 | 0.000 | |
| 多元逐步回归MSR | 0.542 | 10.525 | 6.577 | 0.637 | 5.810 | 4.125 | 0.000 | |
偏最小二乘回归 PLSR | 0.648 | 9.233 | 5.783 | 0.721 | 6.198 | 4.910 | 0.000 | |
表 6 灌木地上生物量不同估测模型效果评价
Table 6 Effect evaluation of different estimation models for aboveground biomass of shrubs
模型 Model | 表达式 Expression | 建模Modeling | 验证Verification | P | ||||
|---|---|---|---|---|---|---|---|---|
| R2 | RMSE | MAE | R2 | RMSE | MAE | |||
| S型曲线S-curve | 0.560 | 0.832 | 0.689 | 0.394 | 0.826 | 0.642 | 0.000 | |
| 多元逐步回归MSR | 0.542 | 10.525 | 6.577 | 0.637 | 5.810 | 4.125 | 0.000 | |
偏最小二乘回归 PLSR | 0.648 | 9.233 | 5.783 | 0.721 | 6.198 | 4.910 | 0.000 | |

图3 研究区灌木最优模型验证
Fig.3 Verification of shrubs optimal model in the study area
模型 Model | 表达式 Expression | 建模Modeling | 验证Verification | P | ||||
|---|---|---|---|---|---|---|---|---|
| R2 | RMSE | MAE | R2 | RMSE | MAE | |||
| 二次项Quadratic term | 0.467 | 5.931 | 4.939 | 0.696 | 5.204 | 4.695 | 0.000 | |
| 多元逐步回归MSR | 0.462 | 5.958 | 4.901 | 0.687 | 5.271 | 4.824 | 0.000 | |
偏最小二乘回归 PLSR | 0.632 | 5.018 | 4.071 | 0.728 | 6.119 | 5.011 | 0.000 | |
表7 研究区草本地上生物量估测模型精度评价
Table 7 Accuracy evaluation of estimation model for herbs aboveground biomass in the study area
模型 Model | 表达式 Expression | 建模Modeling | 验证Verification | P | ||||
|---|---|---|---|---|---|---|---|---|
| R2 | RMSE | MAE | R2 | RMSE | MAE | |||
| 二次项Quadratic term | 0.467 | 5.931 | 4.939 | 0.696 | 5.204 | 4.695 | 0.000 | |
| 多元逐步回归MSR | 0.462 | 5.958 | 4.901 | 0.687 | 5.271 | 4.824 | 0.000 | |
偏最小二乘回归 PLSR | 0.632 | 5.018 | 4.071 | 0.728 | 6.119 | 5.011 | 0.000 | |

图4 研究区草本最优模型验证
Fig.4 Verification of herbs optimal model in the study area
模型 Model | 表达式 Expression | 建模Modeling | 验证Verification | P | ||||
|---|---|---|---|---|---|---|---|---|
| R2 | RMSE | MAE | R2 | RMSE | MAE | |||
| S型曲线S-curve | 0.623 | 22.027 | 16.058 | 0.513 | 18.648 | 14.360 | 0.000 | |
| 多元逐步回归MSR | 0.571 | 19.860 | 13.008 | 0.677 | 17.638 | 13.648 | 0.000 | |
偏最小二乘回归 PLSR | 0.613 | 18.863 | 13.158 | 0.626 | 17.659 | 13.671 | 0.000 | |
表8 研究区农作物地上生物量估测模型精度评价
Table 8 Accuracy evaluation of crops aboveground biomass estimation model in the study area
模型 Model | 表达式 Expression | 建模Modeling | 验证Verification | P | ||||
|---|---|---|---|---|---|---|---|---|
| R2 | RMSE | MAE | R2 | RMSE | MAE | |||
| S型曲线S-curve | 0.623 | 22.027 | 16.058 | 0.513 | 18.648 | 14.360 | 0.000 | |
| 多元逐步回归MSR | 0.571 | 19.860 | 13.008 | 0.677 | 17.638 | 13.648 | 0.000 | |
偏最小二乘回归 PLSR | 0.613 | 18.863 | 13.158 | 0.626 | 17.659 | 13.671 | 0.000 | |
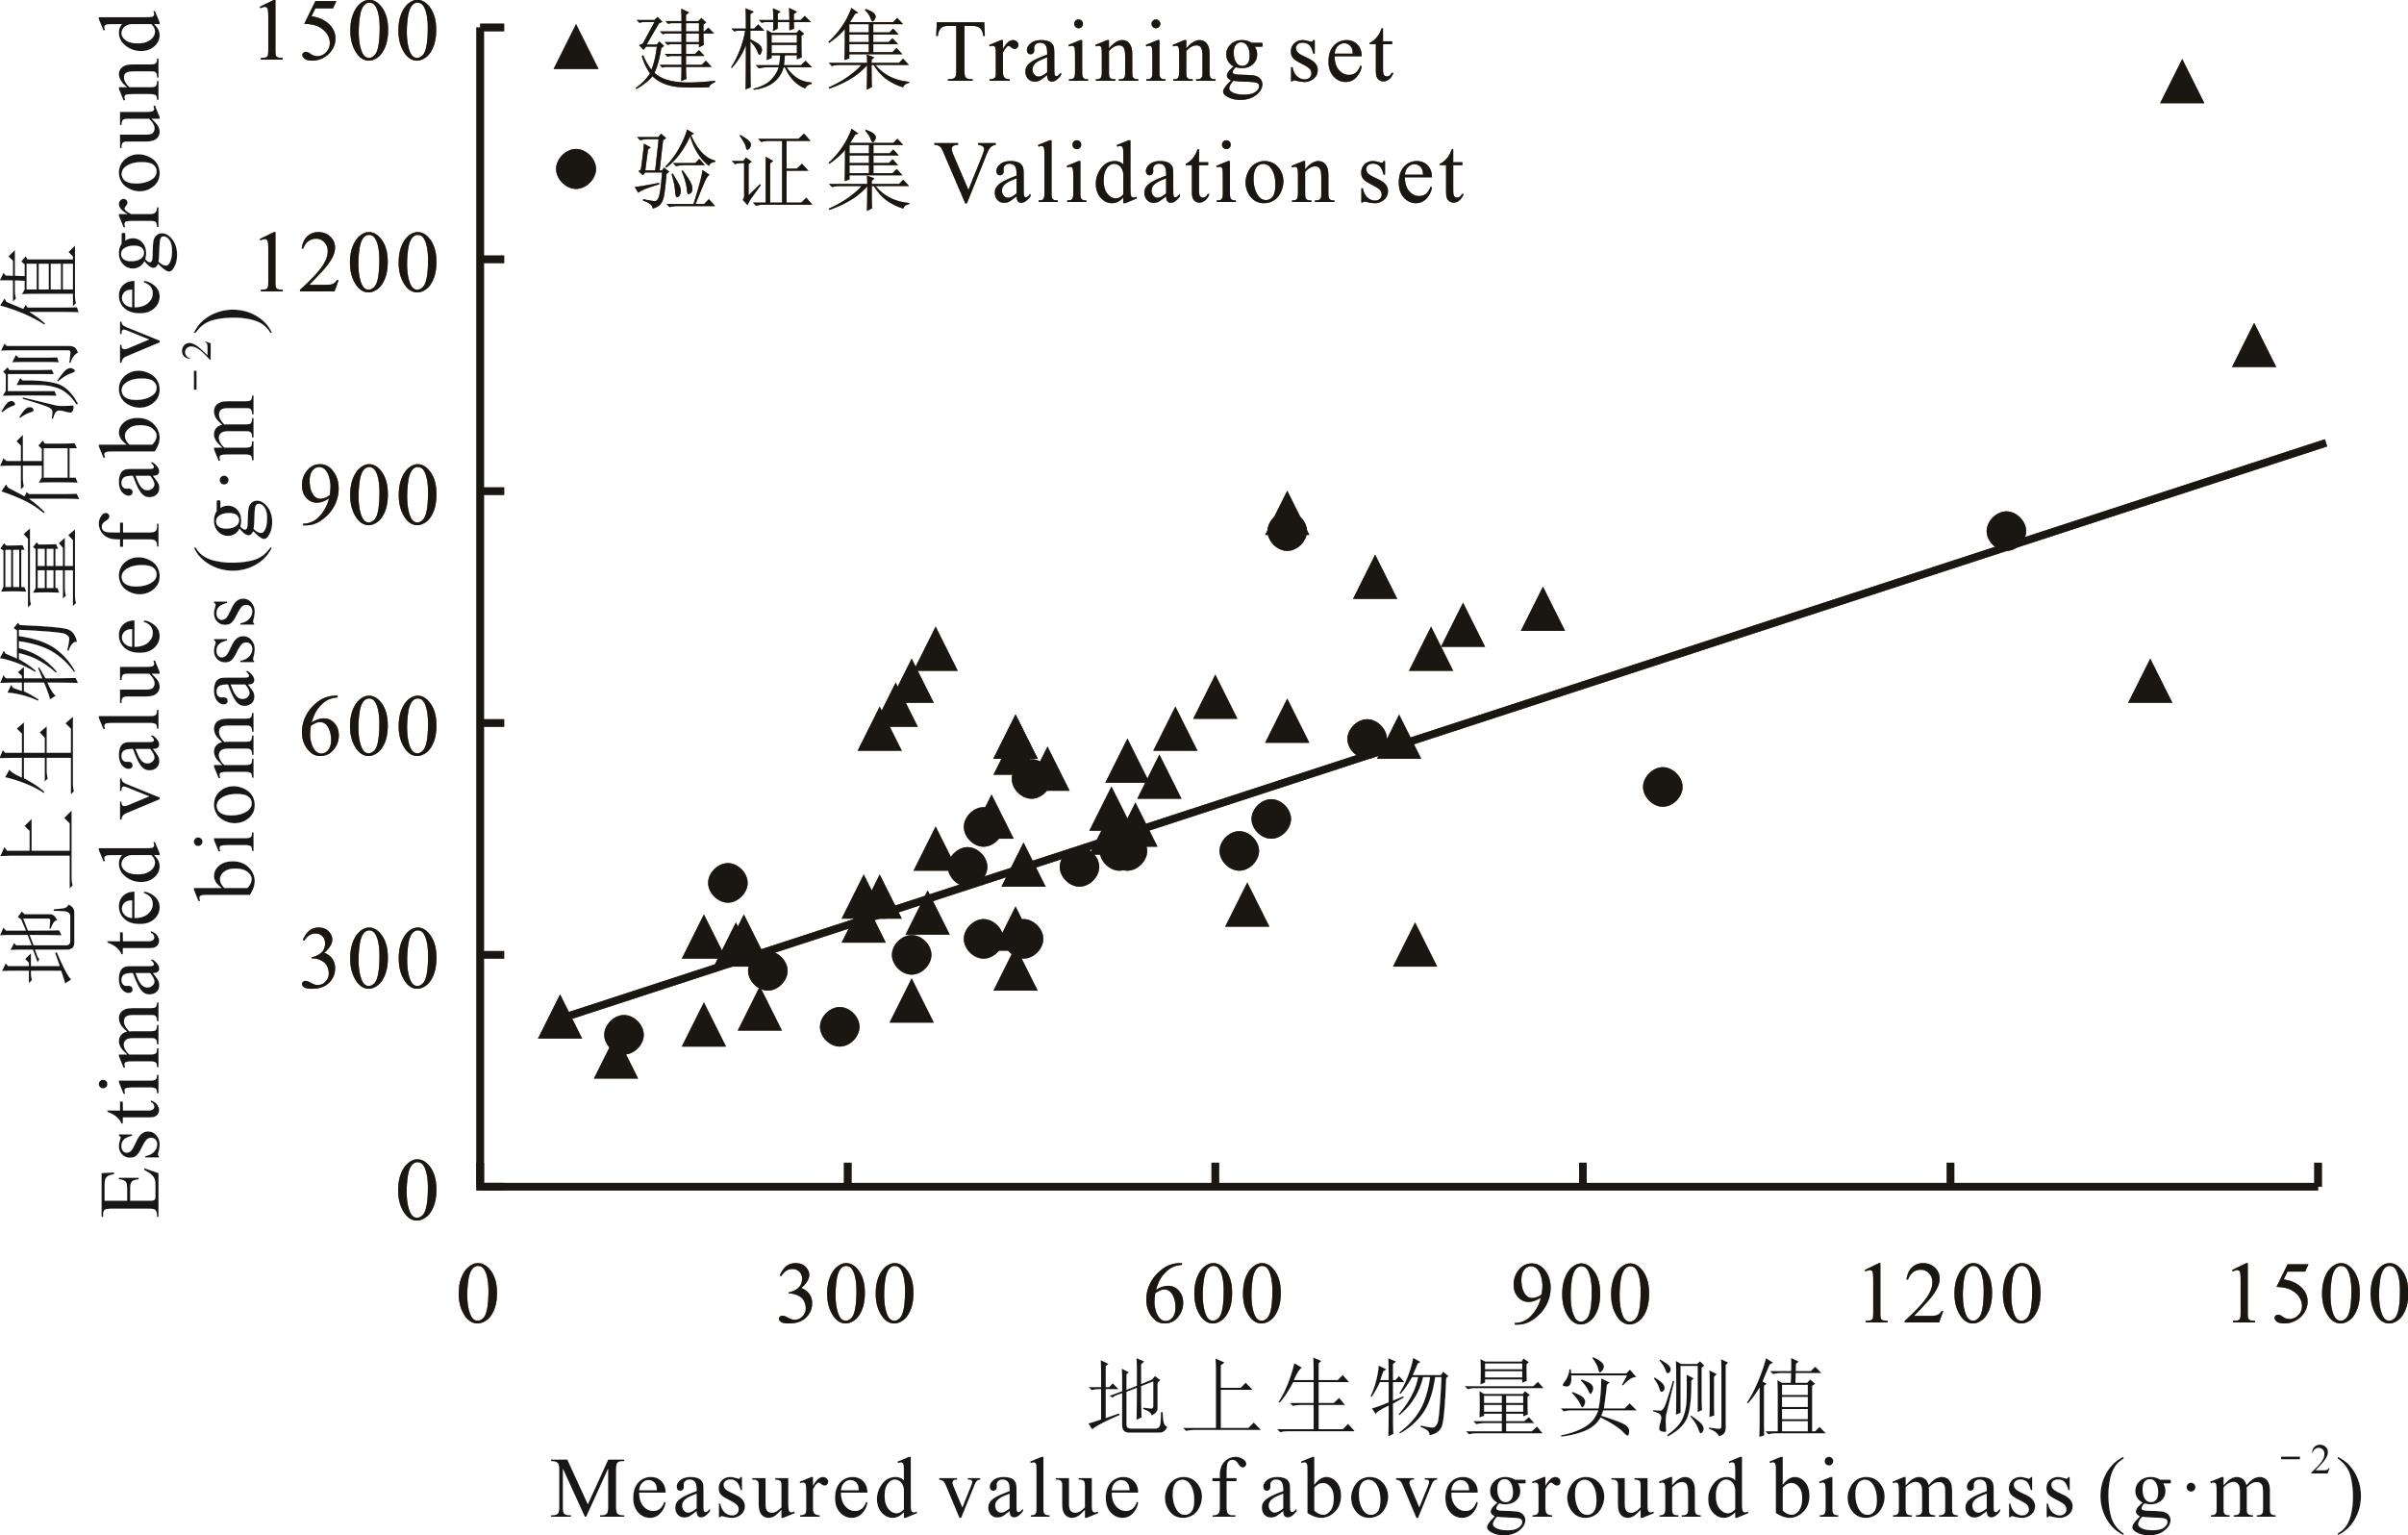
图5 研究区农作物最优模型验证图
Fig.5 Verification map of crops optimal model in the study area
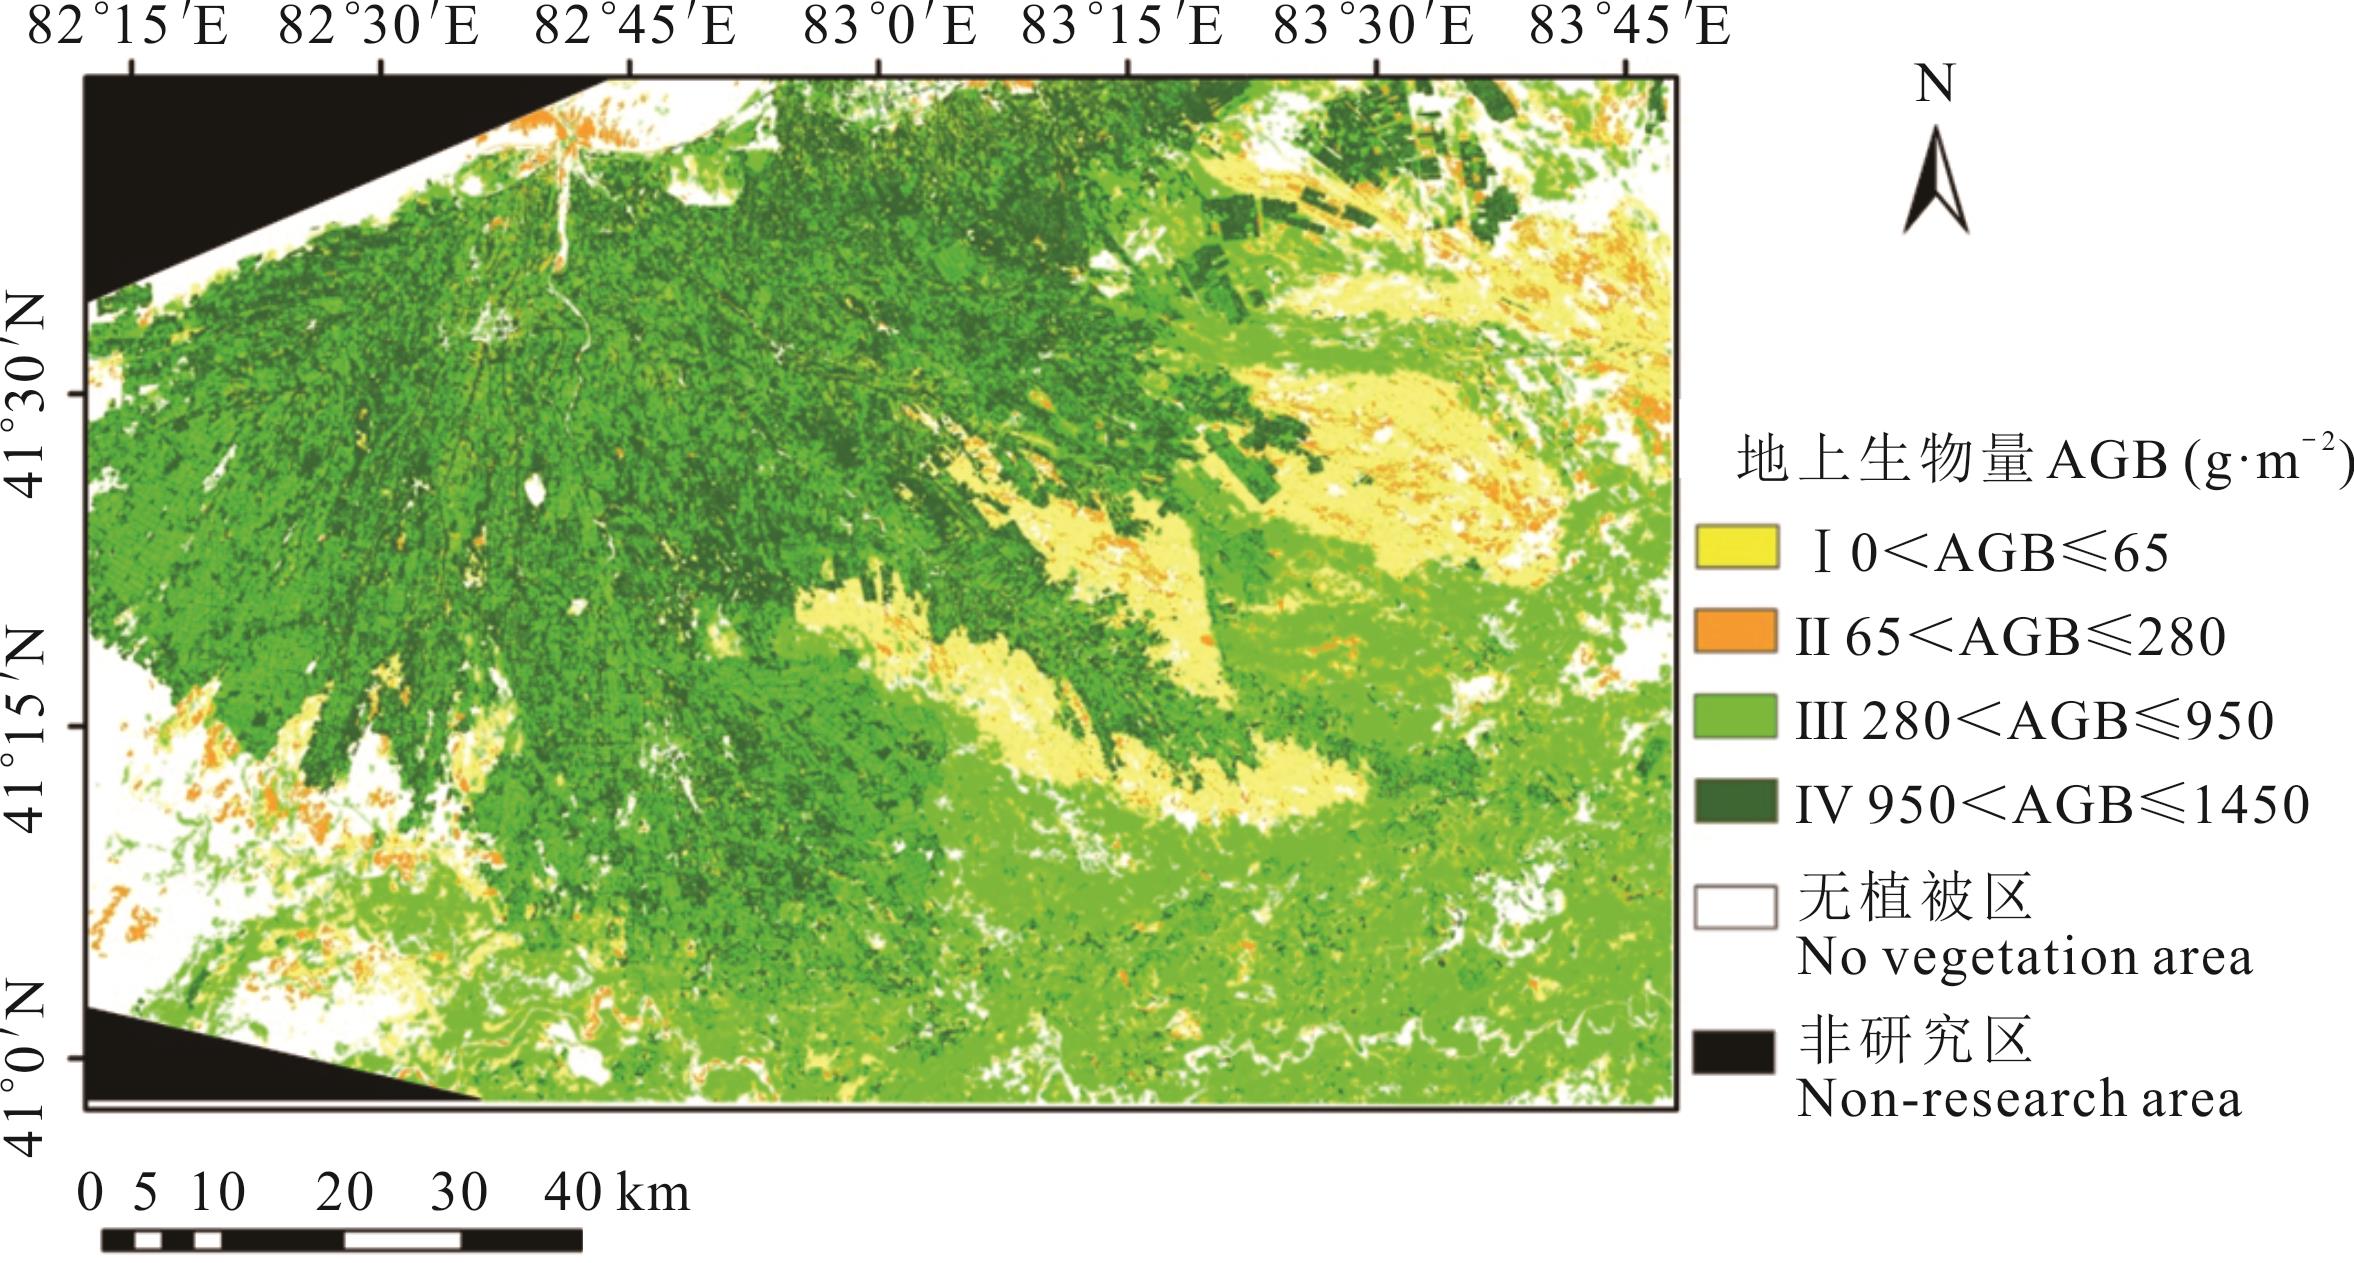
图6 研究区植被地上生物量估测
Fig.6 Estimation of vegetation aboveground biomass in the study area
等级 Grade | 地上生物量 AGB (g·m-2) | 乔木Arbors | 灌木Shrubs | 草本Herbs | 农作物Crops | ||||
|---|---|---|---|---|---|---|---|---|---|
面积 Area (km2) | 百分比 Proportion(%) | 面积 Area (km2) | 百分比 Proportion(%) | 面积 Area (km2) | 百分比 Proportion(%) | 面积 Area (km2) | 百分比 Proportion(%) | ||
| Ⅰ | 0<AGB≤65 | 78.04 | 16.74 | 0.17 | 0.01 | 1245.46 | 75.21 | 45.11 | 0.92 |
| Ⅱ | 65<AGB≤280 | 175.23 | 37.58 | 0.31 | 0.01 | 410.43 | 24.79 | 182.80 | 3.73 |
| Ⅲ | 280<AGB≤950 | 212.98 | 45.68 | 2087.26 | 99.98 | - | - | 1436.62 | 29.31 |
| Ⅳ | 950<AGB≤1450 | - | - | - | - | - | - | 3236.96 | 66.04 |
| 合计Total | - | 466.25 | 100.00 | 2087.74 | 100.00 | 1655.89 | 100.00 | 4901.49 | 100.00 |
表 9 研究区植被地上生物量统计
Table 9 Statistics of vegetation aboveground biomass in study area
等级 Grade | 地上生物量 AGB (g·m-2) | 乔木Arbors | 灌木Shrubs | 草本Herbs | 农作物Crops | ||||
|---|---|---|---|---|---|---|---|---|---|
面积 Area (km2) | 百分比 Proportion(%) | 面积 Area (km2) | 百分比 Proportion(%) | 面积 Area (km2) | 百分比 Proportion(%) | 面积 Area (km2) | 百分比 Proportion(%) | ||
| Ⅰ | 0<AGB≤65 | 78.04 | 16.74 | 0.17 | 0.01 | 1245.46 | 75.21 | 45.11 | 0.92 |
| Ⅱ | 65<AGB≤280 | 175.23 | 37.58 | 0.31 | 0.01 | 410.43 | 24.79 | 182.80 | 3.73 |
| Ⅲ | 280<AGB≤950 | 212.98 | 45.68 | 2087.26 | 99.98 | - | - | 1436.62 | 29.31 |
| Ⅳ | 950<AGB≤1450 | - | - | - | - | - | - | 3236.96 | 66.04 |
| 合计Total | - | 466.25 | 100.00 | 2087.74 | 100.00 | 1655.89 | 100.00 | 4901.49 | 100.00 |
| 1 | Tao Y, Zhang Y M. Multi-scale biomass estimation of desert shrubs: A case study of Haloxylon ammodendron in the Gurbantunggut Desert, China. Acta Prataculturae Sinica, 2013, 22(6): 1-10. |
| 陶冶, 张元明.荒漠灌木生物量多尺度估测——以梭梭为例. 草业学报, 2013, 22(6): 1-10. | |
| 2 | Wu M Y, Dong G, Wang Y J, et al. Estimation of forest aboveground carbon storage in Sichuan Miyaluo Nature Reserve based on remote sensing. Acta Ecologica Sinica, 2020, 40(2): 621-628. |
| 巫明焱, 董光, 王艺积, 等. 川西米亚罗自然保护区森林地上碳储量遥感估算研究. 生态学报, 2020, 40(2): 621-628. | |
| 3 | Guan J R, Shang T Q, Yi L T, et al. Biomass change and community succession characteristics of dominant species in evergreen and deciduous broad-leaved mixed forests in Tianmu Mountain. Acta Ecologica Sinica, 2017, 37(20): 6761-6772. |
| 管杰然, 商天其, 伊力塔, 等. 天目山常绿落叶阔叶混交林优势种生物量变化及群落演替特征. 生态学报, 2017, 37(20): 6761-6772. | |
| 4 | Zhou X, Zuo X A, Zhao X Y, et al. Effect of change in semiarid sand dune habitat on aboveground plant biomass, carbon and nitrogen. Acta Prataculturae Sinica, 2014, 23(6): 36-44. |
| 周欣, 左小安, 赵学勇, 等. 半干旱沙地生境变化对植物地上生物量及其碳、氮储量的影响. 草业学报, 2014, 23(6): 36-44. | |
| 5 | Ren K, Guo K, Zheng J M, et al. Ecological benefits of different vegetation restoration modes along the Xining to Golmud section of Qinghai-Tibet Railway. Chinese Journal of Ecology, 2019, 38(3): 627-636. |
| 任康, 郭坤, 郑景明, 等. 青藏铁路西格段沿线不同植被恢复模式的生态效益. 生态学杂志, 2019, 38(3): 627-636. | |
| 6 | Chu D, Deji Y Z, Ji Q M, et al. Aboveground biomass estimate methods for typical grassland types in the Tibetan Plateau. Remote Sensing for Land and Resources, 2013, 25(3): 43-50. |
| 除多, 德吉央宗, 姬秋梅, 等. 西藏高原典型草地地上生物量遥感估算. 国土资源遥感, 2013, 25(3): 43-50. | |
| 7 | Li L, Chen E X, Li Z Y, et al. A review on forest height and above-ground biomass estimation based on synthetic aperture radar. Remote Sensing Technology and Application, 2016, 31(4): 625-633. |
| 李兰, 陈尔学, 李增元, 等. 合成孔径雷达森林树高和地上生物量估测研究进展. 遥感技术与应用, 2016, 31(4): 625-633. | |
| 8 | Ghosh S M, Behera M D. Aboveground biomass estimation using multi-sensor data synergy and machine learning algorithms in a dense tropical forest. Applied Geography, 2018, 96: 29-40. |
| 9 | Ren Y, Wang H B, Xu D P. Estimation of aboveground biomass of arbor forest based on Landsat 8 image. Forest Resources Management, 2018(6): 38-44. |
| 任怡, 王海宾, 许等平. 基于Landsat 8影像的乔木林地上生物量估算. 林业资源管理, 2018(6): 38-44. | |
| 10 | Qiao Z N, Geng Q H, Xu Y N. Estimating Poplar plantation biomass using satellite remote sensing data. Journal of Northeast Forestry University, 2019, 47(5): 66-71. |
| 乔正年, 耿庆宏, 徐雁南. 运用卫星遥感数据对杨树人工林生物量的估算. 东北林业大学学报, 2019, 47(5): 66-71. | |
| 11 | Yang G Q, Ma Y, Wang J B, et al. AGB of Tamarix remote sensing estimation research based on GF-1 image-Take Changyi Tamarix national special marine reserves as an example. Marine Environmental Science, 2018, 37(1): 78-85, 94. |
| 杨国强, 马毅, 王建步, 等. 基于高分一号卫星影像的柽柳地上生物量遥感估算研究-以昌邑柽柳国家海洋特别保护区为例. 海洋环境科学, 2018, 37(1): 78-85, 94. | |
| 12 | Ding Z D, Sun Y J, Sun Z. Estimation of tree biomass with GF-2. Journal of Beijing Normal University (Natural Science), 2021, 57(1): 135-141. |
| 丁志丹, 孙玉军, 孙钊. 基于GF-2的乔木生物量估测模型研究. 北京师范大学学报(自然科学版), 2021, 57(1): 135-141. | |
| 13 | Yang X F, Zan M, Munire∙M M T. Estimation of above ground biomass of Populus euphratica forest using UAV and satellite remote sensing. Transactions of the Chinese Society of Agricultural Engineering, 2021, 37(1): 77-83. |
| 杨雪峰, 昝梅, 木尼热∙买买提. 基于无人机和卫星遥感的胡杨林地上生物量估算. 农业工程学报, 2021, 37(1): 77-83. | |
| 14 | Zhao H F, Li X D, Zhang D, et al. Aboveground biomass in grasslands in Qinghai Province estimated from MODIS data and its influencing factors. Acta Prataculturae Sinica, 2020, 29(12): 5-16. |
| 赵慧芳, 李晓东, 张东, 等. 基于MODIS数据的青海省草地地上生物量估算及影响因素研究. 草业学报, 2020, 29(12): 5-16. | |
| 15 | Zhou W, Li H, Xie L, et al. Remote sensing inversion of grassland aboveground biomass based on high accuracy surface modeling. Ecological Indicators, 2021, 121: 107215. |
| 16 | Zhang Y, Yin X J, Wang W Q, et al. Estimation of grassland aboveground biomass using Landsat 8 OLI satellite image in the Northern hillside of Tianshan Mountain. Remote Sensing Technology and Application, 2017, 32(6): 1012-1021. |
| 张雅, 尹小君, 王伟强, 等. 基于Landsat 8 OLI遥感影像的天山北坡草地地上生物量估算. 遥感技术与应用, 2017, 32(6): 1012-1021. | |
| 17 | Zhang A W, Zhang S, Guo C F, et al. Grass biomass inversion based on Landsat 8 spectral derived data classification system. Spectroscopy and Spectral Analysis, 2020, 40(1): 239-246. |
| 张爱武, 张帅, 郭超凡, 等. Landsat 8光谱衍生数据分类体系下的牧草生物量反演. 光谱学与光谱分析, 2020, 40(1): 239-246. | |
| 18 | Sun S Z, Wang C J, Yin X J, et al. Estimating aboveground biomass of natural grassland based on multispectral images of unmanned aerial vehicles. Journal of Remote Sensing, 2018, 22(5): 848-856. |
| 孙世泽, 汪传建, 尹小君, 等. 无人机多光谱影像的天然草地生物量估算. 遥感学报, 2018, 22(5): 848-856. | |
| 19 | Xu K, Su Y, Liu J, et al. Estimation of degraded grassland aboveground biomass using machine learning methods from terrestrial laser scanning data. Ecological Indicators, 2020, 108: 105747. |
| 20 | Kang X Y, Zhang A W, Pang H Y. Estimation of grassland aboveground biomass from UAV-mounted hyperspectral image by optimized spectral reconstruction. Spectroscopy and Spectral Analysis, 2021, 41(1): 250-256. |
| 康孝岩, 张爱武, 庞海洋. 基于光谱重建优化的无人机高光谱影像估算牧草生物量. 光谱学与光谱分析, 2021, 41(1): 250-256. | |
| 21 | Li B, Xu X, Zhang L, et al. Above-ground biomass estimation and yield prediction in potato by using UAV-based RGB and hyperspectral imaging. ISPRS Journal of Photogrammetry and Remote Sensing, 2020, 162: 161-172. |
| 22 | Tao H, Feng H, Xu L, et al. Estimation of crop growth parameters using UAV-based hyperspectral remote sensing data. Sensors, 2020, 20(5): 1296. |
| 23 | Liu Y Q, Yan F, Chen J H. Applicating Landsat 8 OLI to estimate biomass in Pisha sandstone area. Research of Soil and Water Conservation, 2021, 28(2): 135-140, 148. |
| 刘雨晴, 闫峰, 陈俊翰. 基于Landsat 8 OLI数据的砒砂岩区生物量遥感估算. 水土保持研究, 2021, 28(2): 135-140, 148. | |
| 24 | Ye J Y, Wu B, Liu M H, et al. Estimation of aboveground biomass of vegetation in the desert-oasis ecotone on the Northeastern edge of the Ulan Buh Desert. Acta Ecologica Sinica, 2018, 38(4): 1216-1225. |
| 叶静芸, 吴波, 刘明虎, 等. 乌兰布和沙漠东北缘荒漠-绿洲过渡带植被地上生物量估算. 生态学报, 2018, 38(4): 1216-1225. | |
| 25 | Wang X M, Dong J J. Estimation of the aboveground biomass of desert steppe and typical steppe in Inner Mongolia using generalized linear model. Acta Agrestia Sinica, 2020, 28(6): 1711-1718. |
| 王秀梅, 董建军. 基于广义线性模型估算内蒙古荒漠草原及典型草原地上生物量变化. 草地学报, 2020, 28(6): 1711-1718. | |
| 26 | He B Z, Ding J L, Liu B H, et al. Spatiotemporal variation of soil salinization in Weigan-Kuqa river delta oasis. Scientia Silvae Sinicae, 2019, 55(9): 185-196. |
| 何宝忠, 丁建丽, 刘博华, 等. 渭库绿洲土壤盐渍化时空变化特征. 林业科学, 2019, 55(9): 185-196. | |
| 27 | Huang Y, Wang X M. Analysis of species diversity of typical plant communities in oasis-desert transition zone of Tarim basin northern margin. Southwest China Journal of Agricultural Sciences, 2018, 31(3): 605-610. |
| 黄晔, 王雪梅. 塔里木盆地北缘绿洲-荒漠过渡带典型植物群落物种多样性分析. 西南农业学报, 2018, 31(3): 605-610. | |
| 28 | Jia X Q, Feng M C, Yang W D, et al. Hyperspectral estimation of aboveground dry biomass of winter wheat based on the combination of vegetation indices. Chinese Journal of Ecology, 2018, 37(2): 424-429. |
| 贾学勤, 冯美臣, 杨武德, 等. 基于多植被指数组合的冬小麦地上干生物量高光谱估测. 生态学杂志, 2018, 37(2): 424-429. | |
| 29 | Ali I, Cawkwell F, Dwyer E, et al. Satellite remote sensing of grasslands: From observation to management-A review. Journal of Plant Ecology, 2016, 9(6): 649-671. |
| 30 | Nesha M K, Hussin Y A, van Leeuwen L M, et al. Modeling and mapping aboveground biomass of the restored mangroves using ALOS-2 PALSAR-2 in East Kalimantan, Indonesia. International Journal of Applied Earth Observation and Geoinformation, 2020, 91: 102158. |
| 31 | Sun L, Wang M, Fan X. Spatial pattern and driving factors of biomass carbon density for natural and planted coniferous forests in mountainous terrain, Eastern Loess Plateau of China. Forest Ecosystems, 2020, 7(1): 104-116. |
| 32 | Wu J Z, Sun F, Cui Y, et al. Relationship between vegetation biomass and soil bulk density on unstable slopes in different climatic regions: A case study of Jiangjiagou watershed in Dongchuan District of Kunming City, Yunnan Province of Southwestern China. Journal of Beijing Forestry University, 2020, 42(3): 24-35. |
| 吴建召, 孙凡, 崔羽, 等. 不同气候区失稳性坡面植被生物量与土壤密度的关系-以云南省昆明市东川区蒋家沟流域为例. 北京林业大学学报, 2020, 42(3): 24-35. |
| [1] | 张峰, 孙嘉伟, 孙宇, 郑佳华, 乔荠瑢, 赵萌莉. 不同载畜率对短花针茅荒漠草原优势物种间关系及其空间分布特征的影响[J]. 草业学报, 2021, 30(8): 1-11. |
| [2] | 马涛, 吕文强, 李泽霞, 陈爱华, 董彦丽. 黄土高原丘陵沟壑区轮作休耕模式下5种土地利用方式土壤剖面水分分布特征[J]. 草业学报, 2020, 29(7): 30-39. |
| [3] | 许爱云, 许冬梅, 曹兵, 刘金龙, 于双, 郭艳菊, 马晓静. 宁夏荒漠草原不同群落蒙古冰草种群空间格局及种间关联性[J]. 草业学报, 2020, 29(3): 171-178. |
| [4] | 张瑶瑶, 冷若琳, 崔霞, 宋清洁, 胥刚. 甘南州高寒草地土壤氮磷空间分布特征[J]. 草业学报, 2018, 27(12): 12-21. |
| [5] | 白娜, 王立, 孔东升. 黑河自然保护区沼泽湿地土壤化学性质的空间分布特征研究[J]. 草业学报, 2017, 26(5): 15-28. |
| [6] | 田耀武, 贺春玲, 刘龙昌, 王宁, 徐少君, 刘晶, 李东升. 退耕草地土壤有机碳密度的空间分布及动态变化[J]. 草业学报, 2016, 25(8): 48-55. |
| [7] | 高金龙, 侯尧宸, 白彦福, 孟宝平, 杨淑霞, 胡远宁, 冯琦胜, 崔霞, 梁天刚. 基于高光谱数据的高寒草甸氮磷钾含量估测方法研究--以青海省贵南县及玛沁县高寒草甸为例[J]. 草业学报, 2016, 25(3): 9-21. |
| [8] | 高金龙, 孟宝平, 杨淑霞, 冯琦胜, 崔霞, 梁天刚. 基于HJ-1A卫星数据的高寒草地氮素评估-以青海省贵南县及玛沁县高寒草地为例[J]. 草业学报, 2016, 25(10): 11-20. |
| [9] | 张旭琛, 朱华忠, 钟华平, 程耀东, 靳瑰丽, 邵小明. 新疆伊犁地区草地植被地上生物量遥感反演[J]. 草业学报, 2015, 24(6): 25-34. |
| [10] | 杨阳,刘秉儒,宋乃平,杨新国. 人工柠条灌丛密度对荒漠草原土壤养分空间分布的影响[J]. 草业学报, 2014, 23(5): 107-115. |
| [11] | 李武斌,何丙辉,王力,申建红,黄治清,张兴华,文基坚,代万贵. 九寨沟马脑壳金矿矿山土壤养分空间分布格局[J]. 草业学报, 2011, 20(3): 1-9. |
| [12] | 柴永青,曹致中,蔡卓山,万丽霞,李学玲. 肃北地区稀有植物裸果木种群的空间分布格局[J]. 草业学报, 2010, 19(5): 239-249. |
| [13] | 徐敏云,李运起,王堃2,3,曹玉凤,于海良4, 李雪枫2,3,李连树4,景福军4,李佳祥4,谢帆. 河北省草地资源分布及植被特征动态[J]. 草业学报, 2009, 18(6): 1-11. |
| [14] | 鲁为华,朱进忠,王东江,靳瑰丽,余博. 天山北坡两种退化梯度下伊犁绢蒿种群空间分布的点格局分析[J]. 草业学报, 2009, 18(5): 142-149. |
| 阅读次数 | ||||||
|
全文 |
|
|||||
|
摘要 |
|
|||||