

ISSN 1004-5759 CN 62-1105/S
草业学报 ›› 2021, Vol. 30 ›› Issue (9): 15-26.DOI: 10.11686/cyxb2020324
刘佳丽1,2( ), 范建容1(), 张茜彧1, 杨超1,2, 徐富宝1,2, 张晓雪3, 梁博3
收稿日期:2020-07-07
修回日期:2020-11-02
出版日期:2021-08-30
发布日期:2021-08-30
通讯作者:
范建容
作者简介:Corresponding author. E-mail: fjrong@imde.ac.cn基金资助:
Jia-li LIU1,2(), Jian-rong FAN1(), Xi-yu ZHANG1, Chao YANG1,2, Fu-bao XU1,2, Xiao-xue ZHANG3, Bo LIANG3
Received:2020-07-07
Revised:2020-11-02
Online:2021-08-30
Published:2021-08-30
Contact:
Jian-rong FAN
摘要:
植被盖度是刻画陆地生态系统植被覆盖的重要生态参量。以当雄县Landsat-8OLI为数据源,从10种常用植被指数中筛选出适合反演高寒草地生长季/非生长季草地植被盖度的植被指数,引入像元三分法确定端元特征值,通过不同植被指数基于像元二分模型反演植被盖度的对比分析,确定适合生长季/非生长季植被盖度最优植被指数,根据反演结果分析了研究区草地生长季/非生长季植被盖度的时空变化特征。结果表明:1)由可见光-近红外波段构建的植被指数适用生长季植被盖度反演,由短波红外构建的植被指数适用于非生长季植被盖度反演。2)基于MSACRI的像元二分模型适合非生长季植被盖度反演,基于NDVI的像元二分模型则最适用于生长季植被盖度的反演。3)研究区草地植被盖度随海拔增加呈现先增加后减少的单峰变化格局,草地集中分布于海拔4300~5100 m处。生长季植被盖度主要集中于20%~80%,非生长季绝大部分的草地盖度小于40%。研究结果可为草地生态系统碳存储、植被生产力、土壤侵蚀、生态水文等研究提供参考依据。
刘佳丽, 范建容, 张茜彧, 杨超, 徐富宝, 张晓雪, 梁博. 高寒草地生长季/非生长季植被盖度遥感反演[J]. 草业学报, 2021, 30(9): 15-26.
Jia-li LIU, Jian-rong FAN, Xi-yu ZHANG, Chao YANG, Fu-bao XU, Xiao-xue ZHANG, Bo LIANG. Remote sensing estimation of vegetation cover in alpine grassland in the growing and non-growing seasons[J]. Acta Prataculturae Sinica, 2021, 30(9): 15-26.

图1 当雄县样地分布
Fig.1 Distribution of sample plots in Dangxiong County
植被指数 Vegetation index | 计算公式 Calculation formula |
|---|---|
| RVI | |
| NDVI | |
| SAVI | |
| TSAVI | |
| MSAVI | |
| NDTI | |
| MSACRI | |
| DFI | |
| STI | |
| S-NDTI |
表1 用于植被盖度估算的几种主要植被指数
Table 1 Several main vegetation indices for grassland coverage estimation
植被指数 Vegetation index | 计算公式 Calculation formula |
|---|---|
| RVI | |
| NDVI | |
| SAVI | |
| TSAVI | |
| MSAVI | |
| NDTI | |
| MSACRI | |
| DFI | |
| STI | |
| S-NDTI |

图2 土壤线
Fig.2 Soil line

图3 NDVI-DFI像元三分模型DFI:干枯燃料指数Dead fuel index;NPV:非光合植被Non-photosynthetic vegetation;BS:土壤Bare soil;PV:光合植被Photosynthetic vegetation;NDVI:归一化植被指数Normalized difference vegetation index.
Fig.3 Tri-endmember linear mixture model with the NDVI and DFI
植被指数 Vegetation index | 4月相关系数 April correlation coefficient | 8月相关系数 August correlation coefficient | 适用性 Applicability |
|---|---|---|---|
| NDVI | 0.73** | 0.88** | 适用于生长季Suitable for growing season |
| RVI | 0.77** | 0.85** | |
| SAVI | 0.73** | 0.88** | |
| TSAVI | 0.73** | 0.88** | |
| MSAVI | 0.71** | 0.88** | |
| NDTI | 0.92** | 0.80** | 适用于非生长季Suitable for non-growing season |
| MSACRI | 0.92** | 0.80** | |
| S-NDTI | 0.92** | 0.80** | |
| DFI | 0.90** | -0.28 | |
| STI | 0.92** | 0.78** |
表2 植被盖度与植被指数的相关性
Table 2 Correlation between grassland coverage and vegetation index
植被指数 Vegetation index | 4月相关系数 April correlation coefficient | 8月相关系数 August correlation coefficient | 适用性 Applicability |
|---|---|---|---|
| NDVI | 0.73** | 0.88** | 适用于生长季Suitable for growing season |
| RVI | 0.77** | 0.85** | |
| SAVI | 0.73** | 0.88** | |
| TSAVI | 0.73** | 0.88** | |
| MSAVI | 0.71** | 0.88** | |
| NDTI | 0.92** | 0.80** | 适用于非生长季Suitable for non-growing season |
| MSACRI | 0.92** | 0.80** | |
| S-NDTI | 0.92** | 0.80** | |
| DFI | 0.90** | -0.28 | |
| STI | 0.92** | 0.78** |

图4 当雄县生长季/非生长季高寒草地植被盖度分布a~e为2019年4月非生长季;f~j为2019年8月生长季。a-e is non-growing season in April 2019, f-j is growing season in August 2019.
Fig.4 Distribution of alpine grassland coverage in growing season/non-growing season in Dangxiong County
非生长季/生长季 Non-growing season/growing season | 植被指数 Vegetation index | 平均相对误差 Average relative error (%) | 均方根误差RMSE | R2 |
|---|---|---|---|---|
| 非生长季Non-growing season | MSACRI | 10.18 | 7.78 | 0.81** |
| S-NDTI | 10.13 | 9.86 | 0.70** | |
| NDTI | 20.09 | 9.47 | 0.72** | |
| STI | 29.96 | 9.38 | 0.73** | |
| DFI | 44.02 | 9.08 | 0.74** | |
| 生长季Growing season | NDVI | 9.23 | 8.43 | 0.77** |
| TSAVI | 11.20 | 11.73 | 0.55** | |
| MSAVI | 13.70 | 11.41 | 0.58** | |
| SAVI | 22.64 | 11.96 | 0.54** | |
| RVI | 21.96 | 12.05 | 0.53** |
表3 像元二分模型植被盖度精度评价
Table 3 The accuracy evaluation of grassland coverage based on dimidiate pixel model
非生长季/生长季 Non-growing season/growing season | 植被指数 Vegetation index | 平均相对误差 Average relative error (%) | 均方根误差RMSE | R2 |
|---|---|---|---|---|
| 非生长季Non-growing season | MSACRI | 10.18 | 7.78 | 0.81** |
| S-NDTI | 10.13 | 9.86 | 0.70** | |
| NDTI | 20.09 | 9.47 | 0.72** | |
| STI | 29.96 | 9.38 | 0.73** | |
| DFI | 44.02 | 9.08 | 0.74** | |
| 生长季Growing season | NDVI | 9.23 | 8.43 | 0.77** |
| TSAVI | 11.20 | 11.73 | 0.55** | |
| MSAVI | 13.70 | 11.41 | 0.58** | |
| SAVI | 22.64 | 11.96 | 0.54** | |
| RVI | 21.96 | 12.05 | 0.53** |
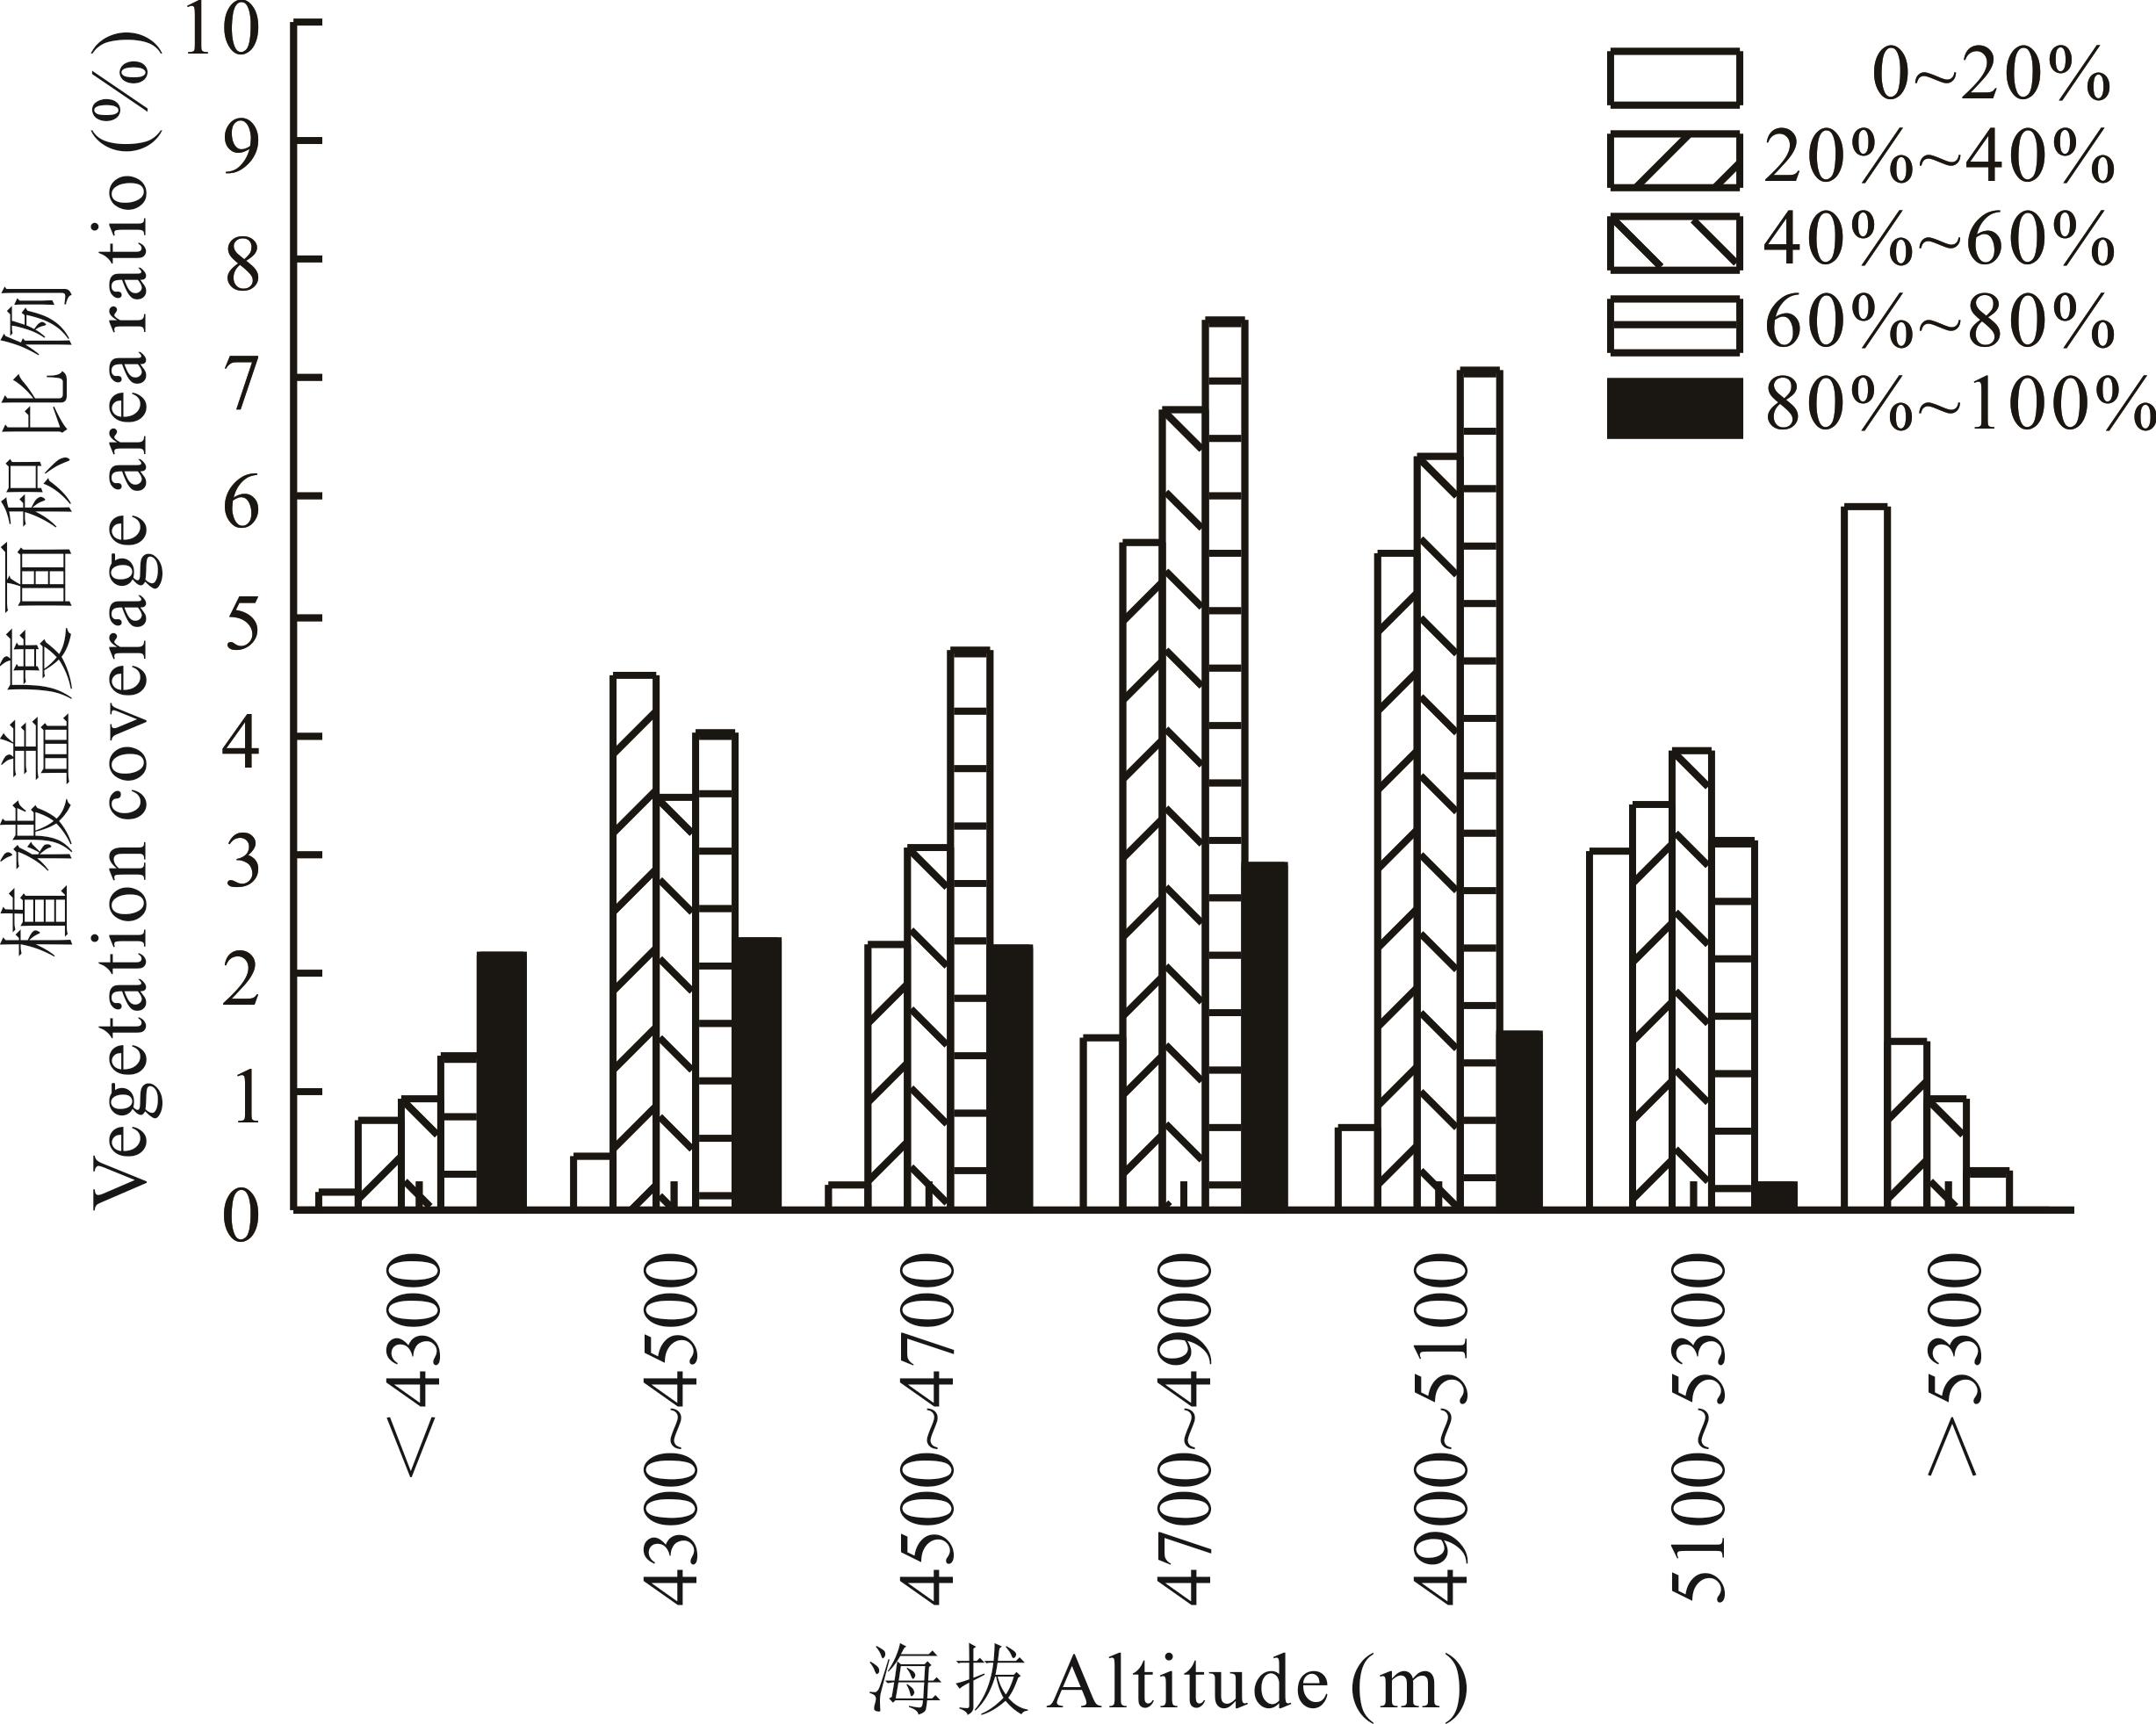
图5 不同海拔生长季植被盖度面积统计
Fig.5 Statistics of vegetation coverage area in different altitude growing seasons
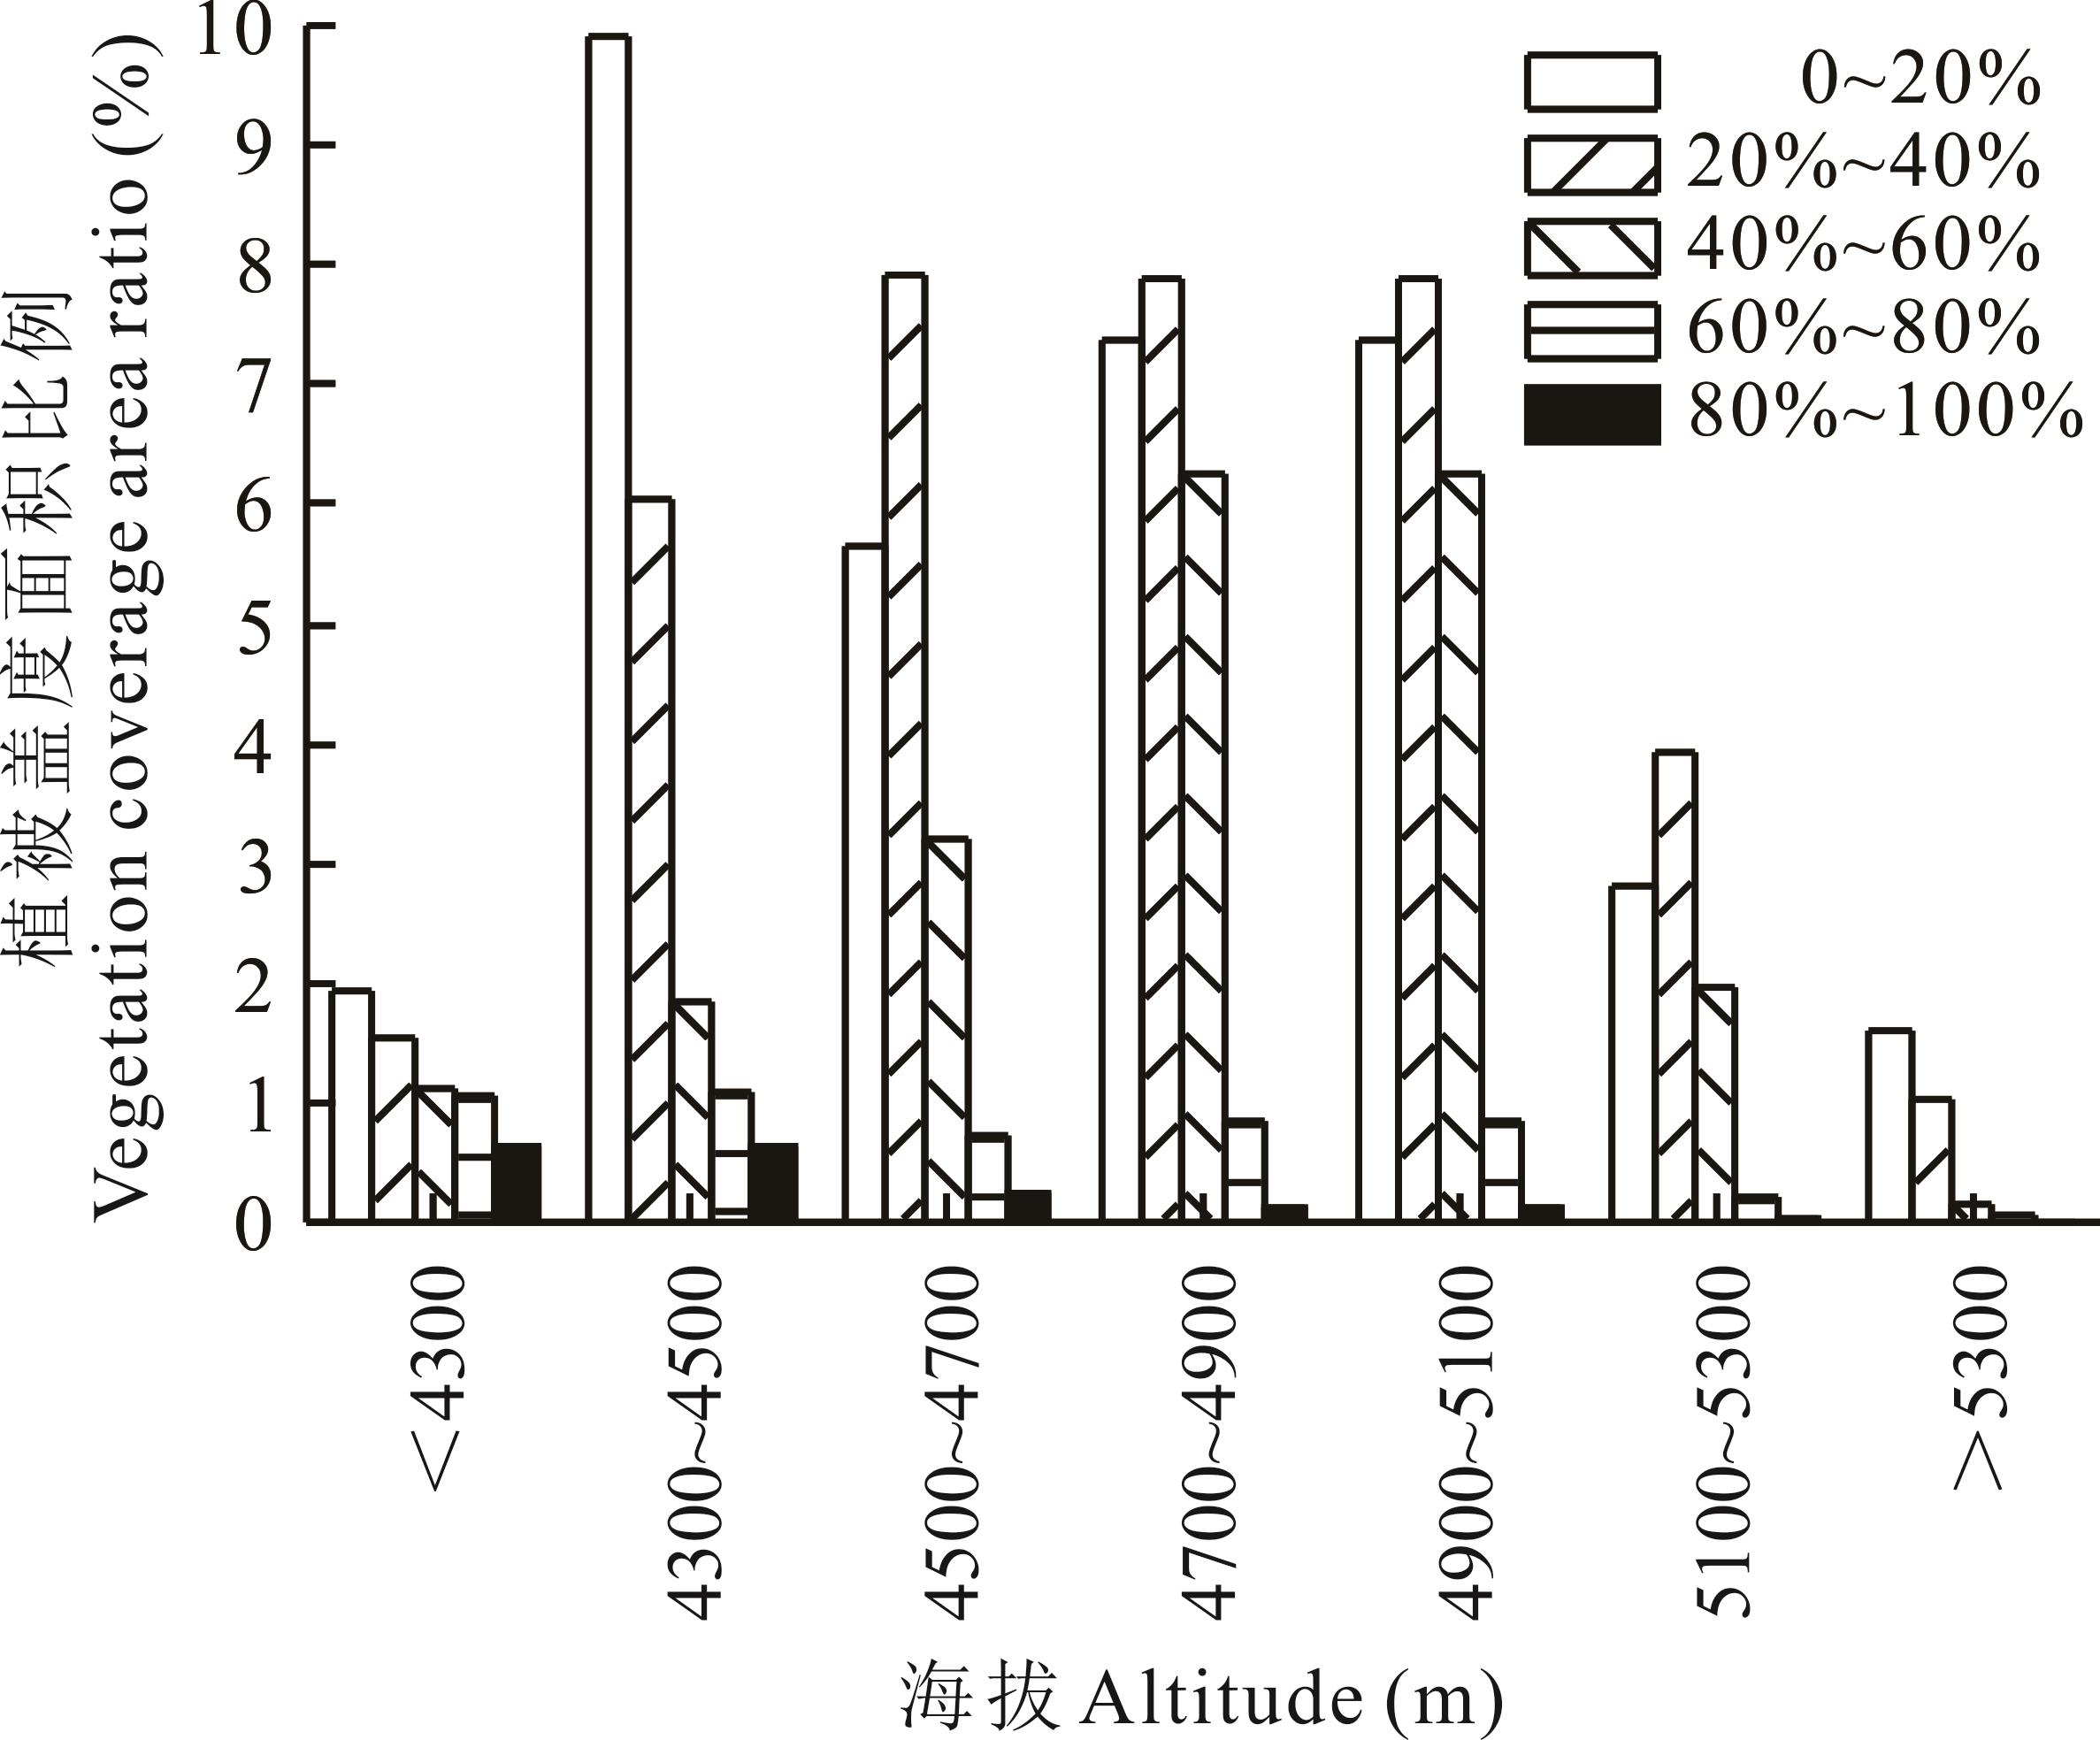
图6 不同海拔非生长季植被盖度面积统计
Fig.6 Statistics of vegetation coverage area in different altitude non-growing seasons
| 1 | Sun H L, Zheng D, Yao T D, et al. Protection and construction of the national ecological security shelter zone on Tibetan Plateau. Acta Geographica Sinica, 2012, 67(1): 3-12. |
| 孙鸿烈, 郑度, 姚檀栋, 等. 青藏高原国家生态安全屏障保护与建设. 地理学报, 2012, 67(1): 3-12. | |
| 2 | Wen Q K, Zhang Z X, Liu B, et al. Research progress in grassland fractional coverage estimation methods. Pratacultural Science, 2009, 26(12): 30-36. |
| 温庆可, 张增祥, 刘斌, 等. 草地覆盖度测算方法研究进展. 草业科学, 2009, 26(12): 30-36. | |
| 3 | Guerschman J P, Hill M J, Renzullo L J, et al. Estimating fractional cover of photosynthetic vegetation, non-photosynthetic vegetation and bare soil in the Australian tropical savanna region upscaling the EO-1 Hyperion and MODIS sensors. Remote Sensing of Environment, 2009, 113(5): 928-945. |
| 4 | Ding M J, Zhang Y L, Liu L S, et al. Temporal and spatial distribution of grassland coverage change in Tibetan Plateau since 1982. Journal of Natural Resources, 2010, 25(12): 2114-2122. |
| 丁明军, 张镱锂, 刘林山, 等. 1982-2009年青藏高原草地覆盖度时空变化特征. 自然资源学报, 2010, 25(12): 2114-2122. | |
| 5 | Chai G Q, Wang J P, Zou X Y, et al. Estimation fractional cover of photosynthetic/non-photosynthetic vegetation in a typical steppe region based on sentinel-2 data. Pratacultural Science, 2018, 35(12): 2836-2844. |
| 柴国奇, 王静璞, 邹学勇, 等. 基于Sentinel-2数据的典型草原光合/非光合植被覆盖度估算. 草业科学, 2018, 35(12): 2836-2844. | |
| 6 | Zhou D W, Sun H X, Zhong R Z, et al. Principles and practice of grassland farming. Acta Agrestia Sinica, 2016, 24(4): 718-725. |
| 周道玮, 孙海霞, 钟荣珍, 等. 草地畜牧理论与实践. 草地学报, 2016, 24(4): 718-725. | |
| 7 | Guo Q, Hu Z M, Li X R, et al. Effects of precipitation timing on aboveground net primary productivity in Inner Mongolia temperate steppe. Acta Ecologica Sinica, 2013, 33(15): 4808-4817. |
| 郭群, 胡中民, 李轩然, 等. 降水时间对内蒙古温带草原地上净初级生产力的影响. 生态学报, 2013, 33(15): 4808-4817. | |
| 8 | Arsenault É, Bonn F. Evaluation of soil erosion protective cover by crop residues using vegetation indices and spectral mixture analysis of multispectral and hyperspectral data. Catena, 2005, 62(2/3): 157-172. |
| 9 | Xia Y, Fan J R, Zhang X Y, et al. Application of composite vegetation index in remote sensing inversion of sparse fractional vegetation cover in alpine steppe. Pratacultural Science, 2017, 34(9): 1767-1777. |
| 夏颖, 范建容, 张茜彧, 等. 复合植被指数在稀疏高寒草原植被盖度遥感反演中的应用. 草业科学, 2017, 34(9): 1767-1777. | |
| 10 | You H Y, Luo C F, Liu Z J, et al. Estimation vegetation coverage based on vegetation index of MODIS data in Qinghai Lake watershed. Remote Sensing Information, 2017, 27(5): 55-60. |
| 游浩妍, 骆成凤, 刘正军, 等. 基于MODIS植被指数估算青海湖流域植被覆盖度研究. 遥感信息, 2017, 27(5): 55-60. | |
| 11 | Li C Y, Fan W T, Li G M, et al. Drive force analysis of changes in grassland coverage on the Qinghai-Tibet Plateau based on NDVI in 2000-2016. Acta Prataculturae Sinica, 2019, 28(10): 25-32. |
| 李重阳, 樊文涛, 李国梅, 等. 基于NDVI的2000-2016年青藏高原牧户草场覆盖度变化驱动力分析. 草业学报, 2019, 28(10): 25-32. | |
| 12 | Chu D, Pubu C R, Deji Y Z, et al. Aboveground biomass estimate methods of grassland in the central Tibet. Journal of Mountain Science, 2013, 31(6): 664-671. |
| 除多, 普布次仁, 德吉央宗, 等. 西藏高原中部草地地上生物量遥感估算方法. 山地学报, 2013, 31(6): 664-671. | |
| 13 | Daughtry C S T, Hunt E R, Mcmurtrey J E. Assessing crop residue cover using shortwave infrared reflectance. Remote Sensing of Environment, 2004, 90(1): 126-134. |
| 14 | Asner G P. Biophysical and biochemical sources of variability in canopy reflectance. Remote Sensing of Environment, 1998, 64(3): 234-253. |
| 15 | Daughtry C S T. Discriminating crop residues from soil by shortwave infrared reflectance. Agronomy Journal, 2001, 93(1): 125. |
| 16 | Deventer V, Ward A, Gowda P H, et al. Using thematic mapper data to identify contrasting soil plains and tillage practices. Photogrammetric Engineering and Remote Sensing, 1997, 1(63): 87-93. |
| 17 | Bannari K, Haboudane D, Mcnairn H, et al. Modified soil adjusted crop residue index (MSACRI): A new index for mapping crop IGARSS 2000. IEEE 2000 International Geoscience and Remote Sensing Symposium. Taking the pulse of the planet: The role of remote sensing in managing the environment. Proceedings (Cat. No.00CH37120). USA: Institute of Electrical and Electronics Engineers, 2000. |
| 18 | Serbin G, Hunt E R, Daughtry C S T, et al. An improved ASTER index for remote sensing of crop residue. Remote Sensing, 2009, 1(4): 971-991. |
| 19 | Cao X, Chen J, Matsushita B, et al. Developing a MODIS-based index to discriminate dead fuel from photosynthetic vegetation and soil background in the Asian steppe area. International Journal of Remote Sensing, 2010, 31(6): 1589-1604. |
| 20 | Asner G P, Heidebrecht K B. Spectral unmixing of vegetation, soil and dry carbon cover in arid regions: Comparing multispectral and hyperspectral observations. International Journal of Remote Sensing, 2002, 23(19): 3939-3958. |
| 21 | Daughtry C S T, Hunt E R, Doraiswamy P C, et al. Remote sensing the spatial distribution of crop residues. Agronomy Journal, 2005, 97(3): 864. |
| 22 | Li X, Wang Z, Zhao J X, et al. Altitudinal variations in the sensitivity of alpine meadow productivity to temperature and precipitation changes along the southern slope of Nyainqentanglha Mountains. Acta Ecologica Sinica, 2017, 37(17): 5591-5601. |
| 李翔, 王忠, 赵景学, 等.念青唐古拉山南坡高寒草甸生产力对温度和降水变化的敏感性及其海拔分异. 生态学报, 2017, 37(17): 5591-5601. | |
| 23 | Yu J H, Liu X S, Luo T X, et al. Seasonal variations of soil temperature and moisture at the upper limit of alpine meadow in north-facing slope of the Nianqingtanggula Mountains. Acta Geographica Sinica, 2012, 67(9): 1246-1254. |
| 俞洁辉, 刘新圣, 罗天祥, 等. 念青唐古拉山北麓草甸海拔分布上限土壤温湿度的季节变化. 地理学报, 2012, 67(9): 1246-1254. | |
| 24 | Rouse J W, Haas R H, Schell J A, et al. Monitoring the vernal advancement and retrogradation (green wave effect) of natural vegetation. Nasa/gsfct Type Final Report, 1974: 371. |
| 25 | Jordan C F. Derivation of leaf-area index from quality of light on the forest floor. Ecology, 1969, 50(4): 663-666. |
| 26 | Huete A R. A soil-adjusted vegetation index (SAVI). Remote Sensing of Environment, 1988, 3(25): 295-309. |
| 27 | Baret F, Guyot G, Major, et al. TSAVI: A vegetation index which minimizes soil brightness effects on LAI and APAR estimation: 12th Canadian symposium on remote sensing geoscience and remote sensing symposium. Canada: Institute of Electrical and Electronics Engineers, 1989. |
| 28 | Qi J, Huete A R, Moran M S, et al. Interpretation of vegetation indices derived from multi-temporal SPOT images. Remote Sensing of Environment, 1993, 44(1): 89-101. |
| 29 | Ren H, Zhou G, Zhang F. Estimation of litter mass in nongrowing seasons in arid grasslands using MODIS satellite data. European Journal of Remote Sensing, 2018, 51(1): 222-230. |
| 30 | Wang G Z, Wang J P, Zou X Y, et al. A review on estimation fractional cover of non-photosynthetic vegetation by using remote sensing. Remote Sensing Technology and Application, 2018, 33(1): 1-9. |
| 王光镇, 王静璞, 邹学勇, 等. 遥感技术估算非光合植被覆盖度研究综述. 遥感技术与应用, 2018, 33(1): 1-9. | |
| 31 | Qi J, Marsett R, Heilman P, et al. Ranges improves satellite-based information and land cover assessments in southwest United States. Eos Transactions of the American Geophysical Union, 2002(83): 601-606. |
| 32 | Dai J, Roberts D, Dennison P, et al. Spectral-radiometric differentiation of non-photosynthetic vegetation and soil within Landsat and Sentinel 2 wavebands. Remote Sensing Letters, 2018, 9(8): 733-742. |
| 33 | Asner G P, Borghi C E, Ojeda R A. Desertification in central argentina: Changes in ecosystem carbon and nitrogen from imaging spectroscopy. Ecological Applications, 2003, 13(3): 629-648. |
| 34 | Ren W M. Study on the applicability of vegetation index calculation area vegetation coverage. Xi’an: Northwest University, 2012. |
| 任唯敏. 植被指数计算区域植被覆盖度的适用性研究. 西安: 西北大学, 2012. | |
| 35 | Zhang C. Remote sensing inversion and spatio-temporal dynamic analysis of litter coverage: A case study in the loess hilly-gully region. Xi’an: Northwest University, 2019. |
| 张超. 枯枝落叶层盖度遥感反演及时空变化分析. 西安: 西北大学, 2019. | |
| 36 | Yang J Y. Ground biomass simulation of the grassland in Hejing County of Xinjiang based on vegetation index. Urumqi: Xinjiang Normal University, 2017. |
| 杨静雅. 基于植被指数的新疆和静县草原地上生物量模拟. 乌鲁木齐: 新疆师范大学, 2017. | |
| 37 | Ge J, Meng B P, Yang S X, et al. Monitoring of above-ground biomass in alpine grassland based on agricultural digital camera and MODIS remote sensing data: A case study in the Yellow River headwater region. Acta Prataculturae Sinica, 2017, 26(7): 23-34. |
| 葛静, 孟宝平, 杨淑霞, 等. 基于ADC和MODIS遥感数据的高寒草地地上生物量监测研究——以黄河源区为例. 草业学报, 2017, 26(7): 23-34. | |
| 38 | Li M M. The method of vegetation fraction estimation by remote sensing. Beijing: Graduate School of Chinese Academy of Sciences (Research Institute of Remote Sensing Application), 2003. |
| 李苗苗. 植被覆盖度的遥感估算方法研究. 北京: 中国科学院研究生院(遥感应用研究所), 2003. | |
| 39 | Jin Y L, Wang Z, Zhang L. Altitudinal differentiation of alpine grassland NDVI and its indications in Dangxiong County, Tibet. Journal of Natural Resources, 2015, 30(6): 929-937. |
| 金远亮, 王忠, 张林. 西藏当雄县高寒草地NDVI的海拔分异特征及其指示. 自然资源学报, 2015, 30(6): 929-937. |
| [1] | 张亦然, 刘廷玺, 童新, 段利民, 吴宇辰. 基于XGBoost算法的草甸地上生物量的高光谱遥感反演[J]. 草业学报, 2021, 30(4): 1-12. |
| [2] | 李聪聪, 周亚星, 谷强, 杨明新, 朱传鲁, 彭子原, 薛凯, 赵新全, 王艳芬, 纪宝明, 张静. 三江源区典型高寒草地丛枝菌根真菌多样性及构建机制[J]. 草业学报, 2021, 30(1): 46-58. |
| [3] | 陈红, 马文明, 周青平, 杨智, 刘超文, 刘金秋, 杜中曼. 高寒草地灌丛化对土壤团聚体稳定性及其铁铝氧化物分异的研究[J]. 草业学报, 2020, 29(9): 73-84. |
| [4] | 陆丰帅, 阿的鲁骥, 程云湘, 侯扶江. 祁连山高寒草原土壤水分与植被盖度的关系[J]. 草业学报, 2020, 29(11): 23-32. |
| [5] | 宋梅玲, 王玉琴, 鲍根生, 王宏生. 狼毒防除对高寒草地群落植物养分重吸收的影响[J]. 草业学报, 2020, 29(10): 47-57. |
| [6] | 刘雪儿, 马金凤, 杨成德, 李统华. 青海高寒草地针茅根际土壤细菌拮抗功能评价及鉴定[J]. 草业学报, 2019, 28(8): 161-169. |
| [7] | 李海云, 姚拓, 马亚春, 张慧荣, 路晓雯, 杨晓蕾, 夏东慧, 张建贵, 高亚敏. 祁连山中段退化高寒草地土壤细菌群落分布特征[J]. 草业学报, 2019, 28(8): 170-179. |
| [8] | 张建贵, 王理德, 姚拓, 李海云, 高亚敏, 杨晓玫, 李昌宁, 李琦, 冯影, 胡彦婷. 祁连山高寒草地不同退化程度植物群落结构与物种多样性研究[J]. 草业学报, 2019, 28(5): 15-25. |
| [9] | 雷玮倩, 胡玉福, 杨泽鹏, 何剑锋, 肖海华, 舒向阳, 阳帆, 李正青. 垦殖对川西北高寒草地土壤中不同磷组分含量的影响[J]. 草业学报, 2019, 28(5): 36-45. |
| [10] | 焦婷, 吴铁成, 吴建平, 赵生国, 雷赵民, 梁建勇, 冉福, 九麦扎西, 刘振恒. 不同类型藏羊消化率与采食量的比较研究[J]. 草业学报, 2019, 28(5): 100-108. |
| [11] | 张苗苗, 陈伟, 林丽, 张德罡, 吴玉鑫, 肖海龙. 青海省不同高寒草地土壤主要养分及可溶性有机碳特性研究[J]. 草业学报, 2019, 28(3): 20-28. |
| [12] | 王学霞, 董世魁, 高清竹, 张勇, 胡国铮, 罗文蓉. 青藏高原退化高寒草地土壤氮矿化特征以及影响因素研究[J]. 草业学报, 2018, 27(6): 1-9. |
| [13] | 荀其蕾,董乙强,安沙舟,闫凯. 基于MOD 09GA数据的新疆草地生长状况遥感监测研究[J]. 草业学报, 2018, 27(4): 10-26. |
| [14] | 栗文瀚, 干珠扎布, 曹旭娟, 闫玉龙, 李钰, 罗文蓉, 胡国铮, 旦久罗布, 何世丞, 高清竹. 海拔梯度对藏北高寒草地生产力和物种多样性的影响[J]. 草业学报, 2017, 26(9): 200-207. |
| [15] | 林慧龙, 郑舒婷, 王雪璐. 基于RUSLE模型的三江源高寒草地土壤侵蚀评价[J]. 草业学报, 2017, 26(7): 11-22. |
| 阅读次数 | ||||||
|
全文 |
|
|||||
|
摘要 |
|
|||||