

ISSN 1004-5759 CN 62-1105/S
草业学报 ›› 2022, Vol. 31 ›› Issue (1): 1-12.DOI: 10.11686/cyxb2020510
• 研究论文 •
张仁平1,2( ), 郭靖3, 马晓芳4, 郭伟勇5
收稿日期:2020-11-17
修回日期:2021-01-27
出版日期:2021-12-01
发布日期:2021-12-01
通讯作者:
张仁平
作者简介:张仁平(1979-),男,甘肃甘谷人,副教授,博士。E-mail: zrp2013@126.com。Corresponding author. E-mail: zrp2013@126.com
基金资助:
Ren-ping ZHANG1,2(), Jing GUO3, Xiao-fang MA4, Wei-yong GUO5
Received:2020-11-17
Revised:2021-01-27
Online:2021-12-01
Published:2021-12-01
Contact:
Ren-ping ZHANG
摘要:
基于遥感手段监测植被物候涉及两个重要步骤,一是植被指数的重构方法,二是植被物候参数提取方法的选择。不同区域植被物候重构与提取方法的优劣尚无定论,有必要开展不同方法之间的对比分析,从而找到适合某区域最优的遥感提取方法。本研究基于非对称性高斯函数拟合法(asymmetric gaussian,A-G)、双逻辑斯蒂函数拟合法(double logistic,D-L)、Savitzky-Golay滤波法(S-G)和土地覆盖动态产品(MCD12Q2)4种方法反演了2001-2019年新疆地区草地的返青期(start of growing season,SOS),通过4种方法提取结果对比,找到了适合提取新疆地区返青期的最优模型,并以此对新疆草地返青期时空变化进行研究。结果表明:1)A-G方法反演的新疆草地返青期的结果最佳。A-G和实测点的返青期相关性(R=0.879)较高,均方根误差较小(RMSE=16.395 d)。空间上,A-G方法提取的返青期标准差(<30 d)的面积比例最多,达到82.19%。2)近19年,新疆草地返青期主要集中在第60~140天,且具有自北向南逐渐推迟的明显地域差异。北部准噶尔盆地和伊犁河谷区域的草地返青时间最早,早于第80天,而阿尔泰山、天山中部及昆仑山等区域的草地返青时间最晚,晚于第140天。不同草地类型返青期存在明显的差异,高寒草甸与高寒草原的返青时间最晚,而温性荒漠返青时间最早。3)2001-2019年新疆草地返青期总体呈现微弱的推迟趋势,推迟的面积比例约为53.07%。其中,低地草甸、温性荒漠和高寒荒漠的返青期呈现推迟的变化趋势,而温性草原、高寒草原及高寒草甸的返青期表现为提前趋势。
张仁平, 郭靖, 马晓芳, 郭伟勇. 基于MODIS数据的新疆草地物候提取方法及变化趋势分析[J]. 草业学报, 2022, 31(1): 1-12.
Ren-ping ZHANG, Jing GUO, Xiao-fang MA, Wei-yong GUO. Grassland phenology extraction for Xinjiang Province and trend analysis using MODIS data[J]. Acta Prataculturae Sinica, 2022, 31(1): 1-12.

图1 研究区草地类型及地面观测点分布
Fig.1 Distributions of the grasslands and ground observation points in Xinjiang

图2 返青期观测数据与遥感反演数据的对比分析
Fig.2 The comparison between phenology observed in the ground stations and phenology extracted by asymmetric gaussian, double logistic, Savitzky-Golay and MCD12Q2 retrieval

图3 不同方法反演的返青期(SOS)标准差分布
Fig.3 Distribution of the standard deviation of SOS in Xinjiang inverted by different methods
物候时间 Phenological time (d) | 非对称性高斯函数拟合法 Asymmetric gaussian | 双逻辑斯蒂函数拟合法 Double logistic | S-G滤波法 Savitzky-Golay | 物候产品数据 MCD12Q2 |
|---|---|---|---|---|
| <15 | 42.0 | 40.7 | 37.3 | 85.0 |
| 15~30 | 40.2 | 35.8 | 30.7 | 11.8 |
| 30~45 | 12.6 | 15.0 | 19.7 | 2.6 |
| 45~60 | 4.2 | 6.8 | 8.3 | 0.4 |
| >60 | 1.0 | 1.6 | 4.1 | 0.2 |
表1 不同方法反演的返青期标准差面积比例
Table1 Standard deviation area ratio of SOS inverted by different methods (%)
物候时间 Phenological time (d) | 非对称性高斯函数拟合法 Asymmetric gaussian | 双逻辑斯蒂函数拟合法 Double logistic | S-G滤波法 Savitzky-Golay | 物候产品数据 MCD12Q2 |
|---|---|---|---|---|
| <15 | 42.0 | 40.7 | 37.3 | 85.0 |
| 15~30 | 40.2 | 35.8 | 30.7 | 11.8 |
| 30~45 | 12.6 | 15.0 | 19.7 | 2.6 |
| 45~60 | 4.2 | 6.8 | 8.3 | 0.4 |
| >60 | 1.0 | 1.6 | 4.1 | 0.2 |
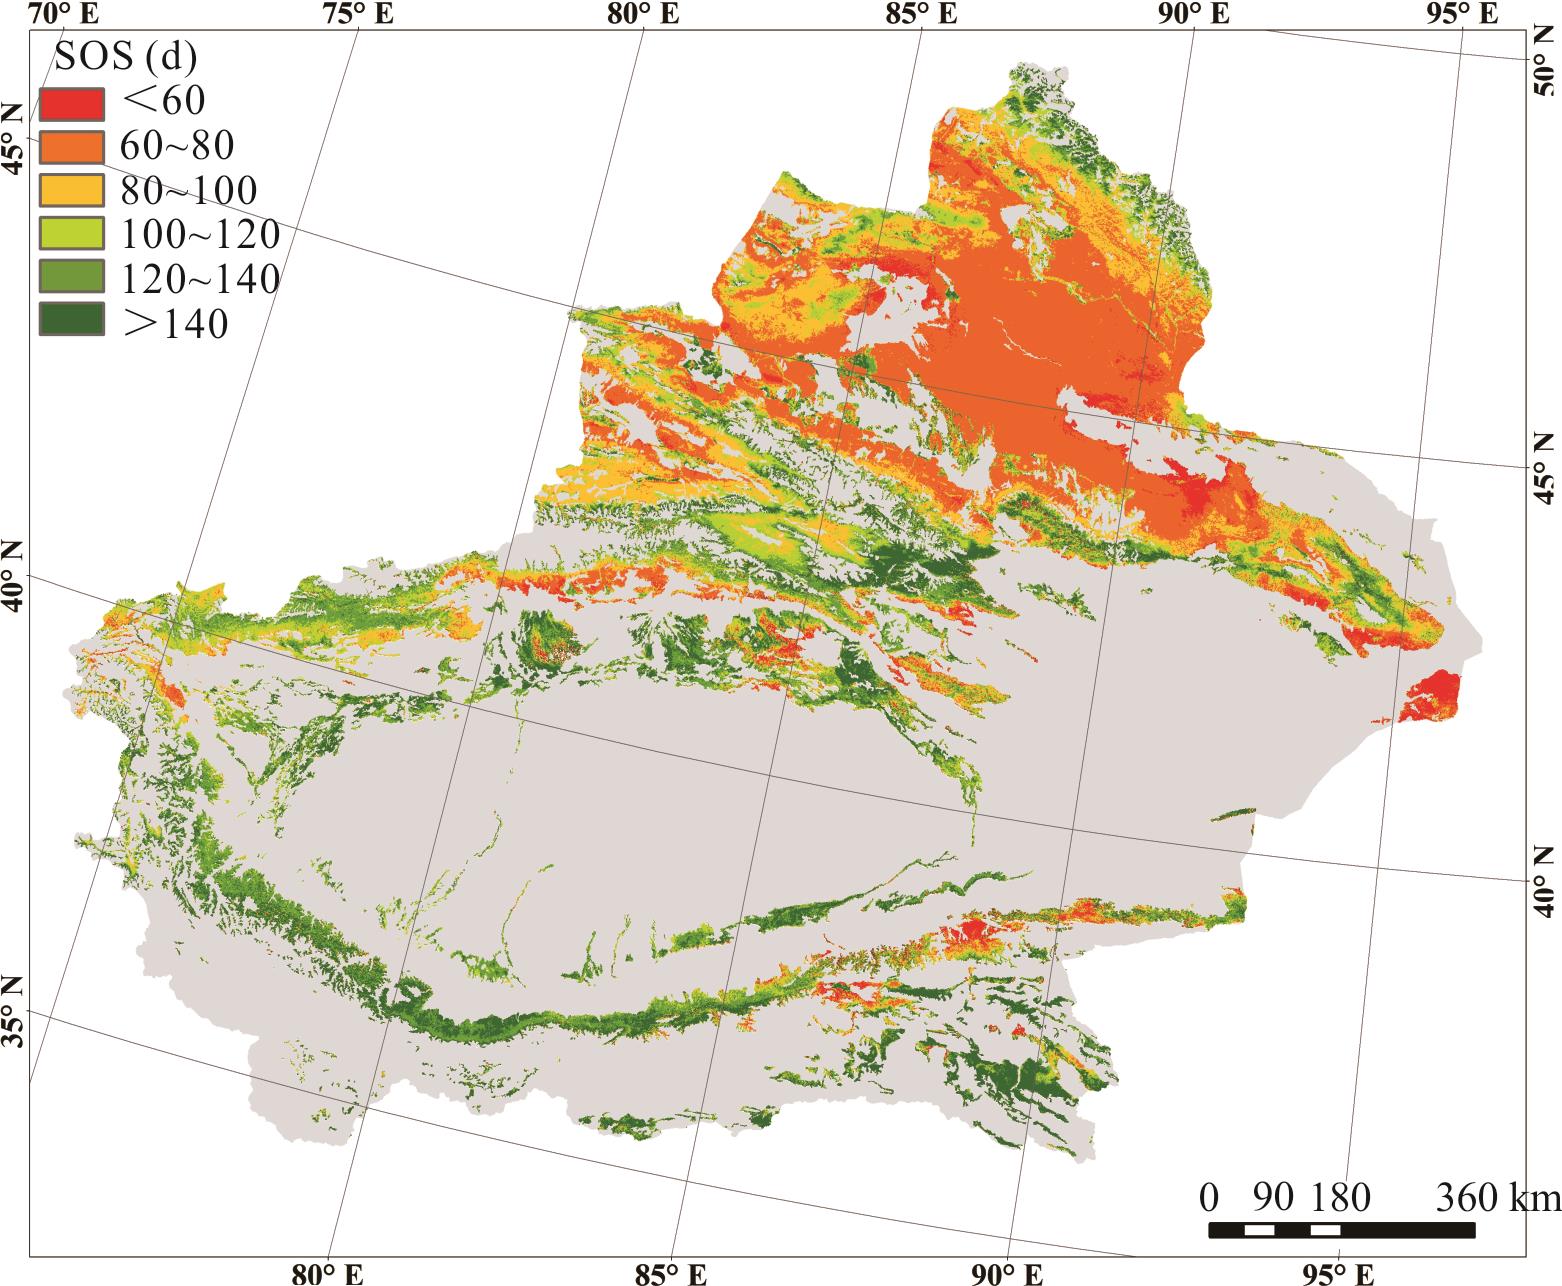
图4 基于A-G方法新疆草地返青期(SOS)的空间分布
Fig.4 Spatial distribution of SOS in Xinjiang based on A-G method
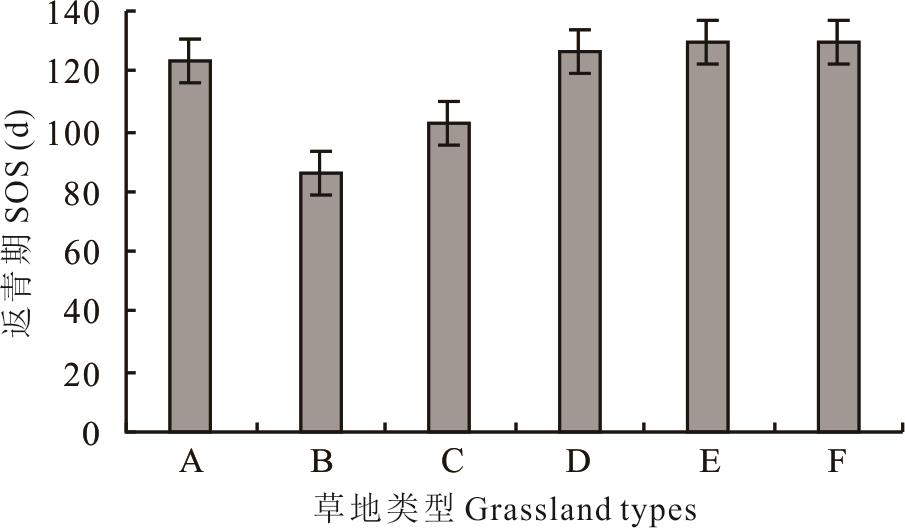
图5 基于A-G方法不同草地类型返青期(SOS)的多年均值A: 低地草甸Lowland meadow; B: 温性荒漠Temperate desert; C: 温性草原Temperate grassland; D: 高寒荒漠Alpine desert; E: 高寒草原Alpine grassland; F: 高寒草甸Alpine meadow.
Fig.5 Multi-year mean values of SOS for different grassland types based on the A-G method
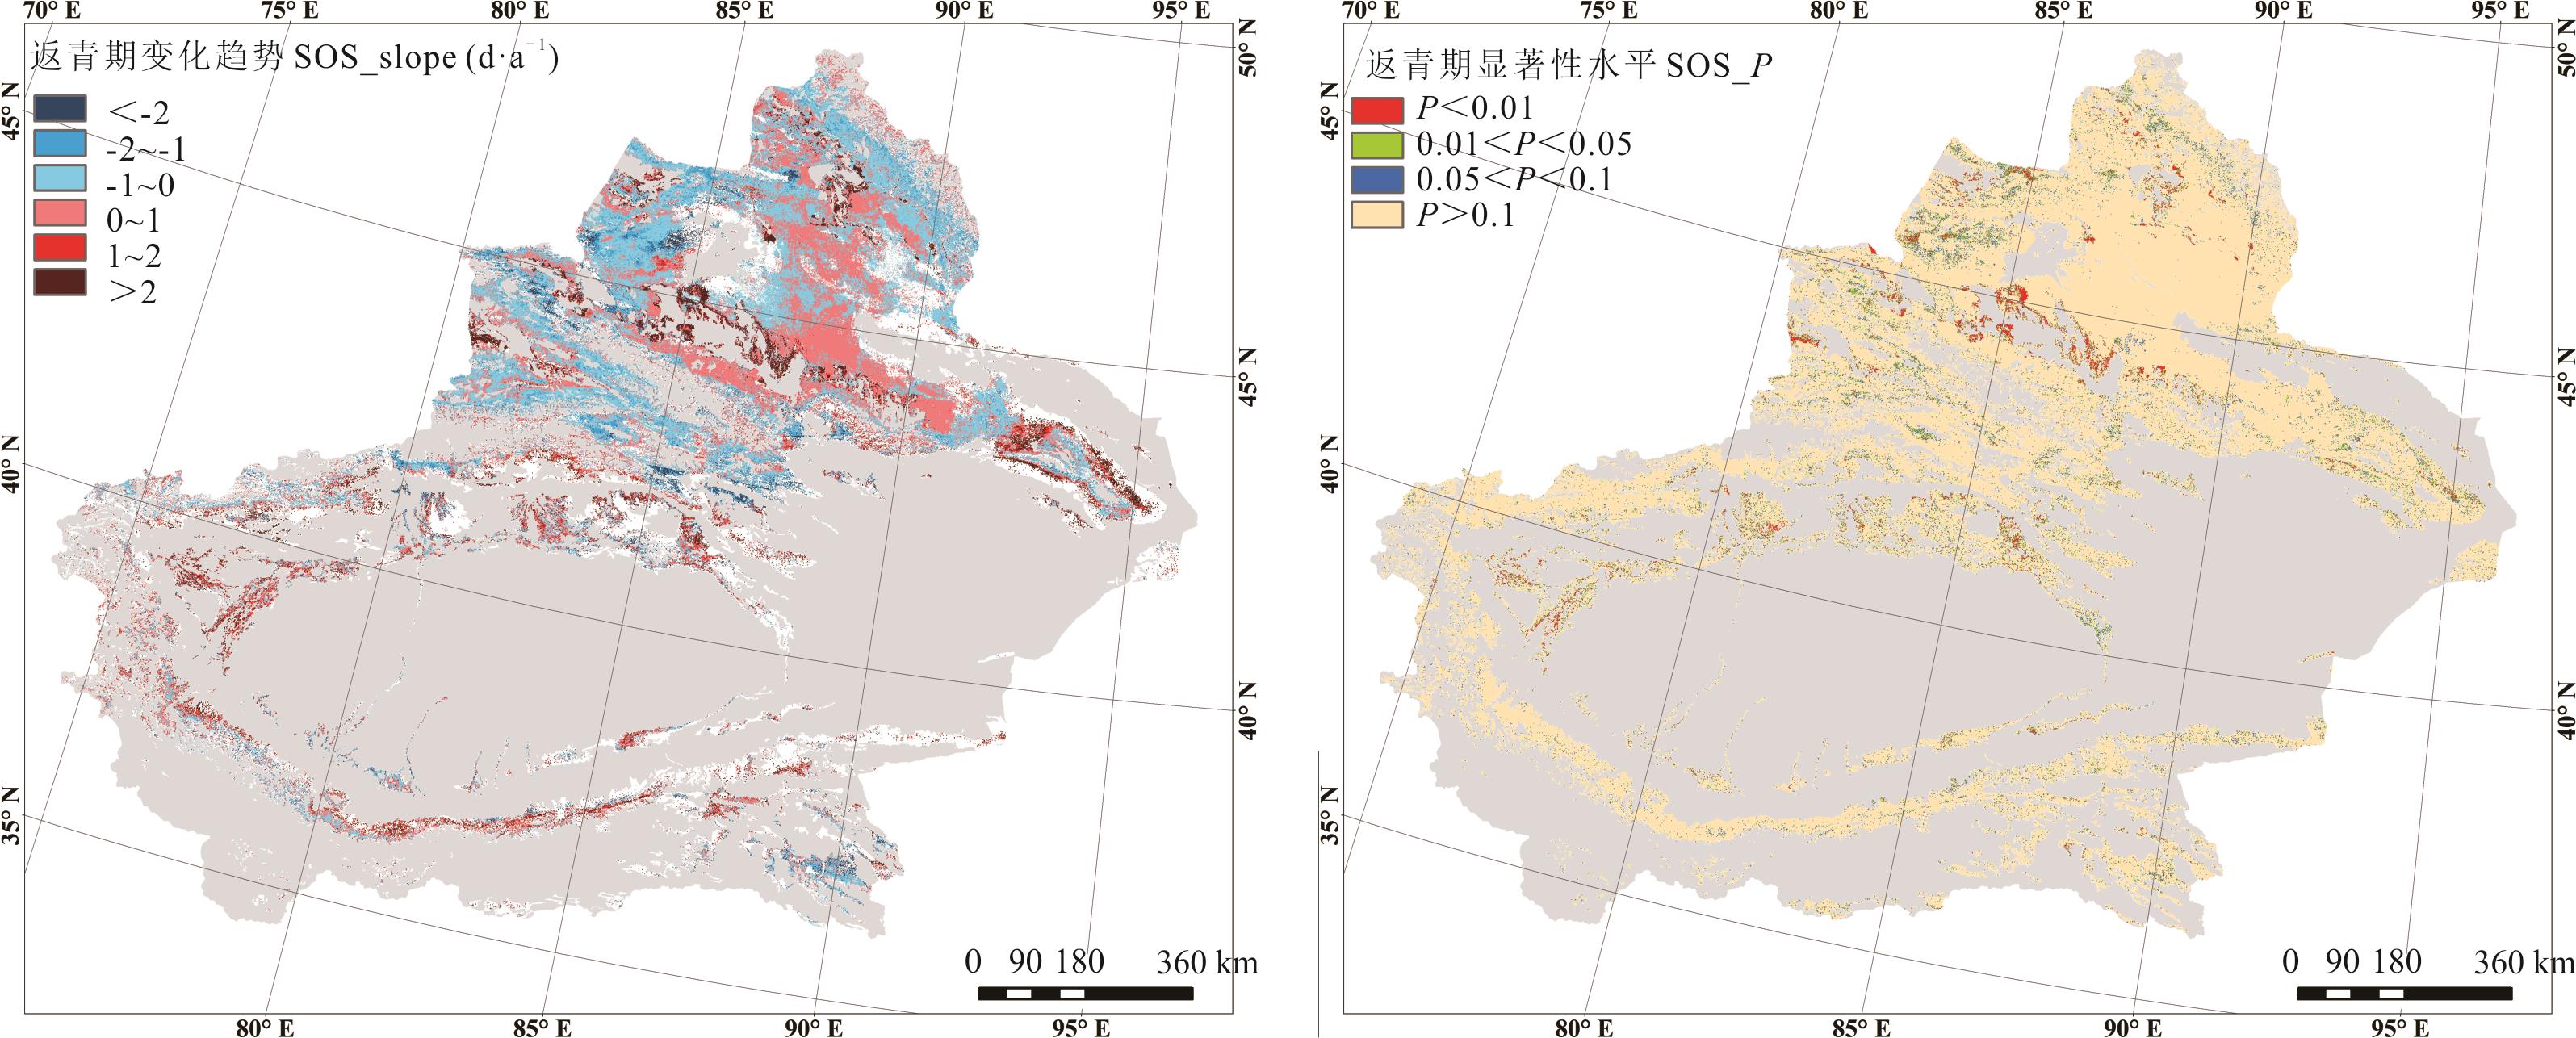
图6 基于A-G方法新疆草地返青期(SOS)的空间变化及显著性检验
Fig.6 Variation trend and significance test of grassland SOS in Xinjiang based on A-G method

图7 基于A-G方法不同草地类型返青期(SOS)的年际变化趋势
Fig.7 The interannual variation trend of SOS in different grassland types based on A-G method
| 1 | Lu P L, Yu Q, He Q T. Responses of plant phenology to climate change. Acta Ecologica Sinica, 2006, 26(3): 923-929. |
| 陆佩玲, 于强, 贺庆棠. 植物物候对气候变化的响应. 生态学报, 2006, 26(3): 923-929. | |
| 2 | Wang L X, Chen H L, Li Q, et al. Research advances in plant phenology and climate. Acta Ecologica Sinica, 2010, 30(2): 447-454. |
| 王连喜, 陈怀亮, 李琪, 等. 植物物候与气候研究进展. 生态学报, 2010, 30(2): 447-454. | |
| 3 | Jeong S J, Ho C H, Gim H J, et al. Phenology shifts at start vs end of growing season in temperate vegetation over the Northern Hemisphere for the period 1982-2008. Global Change Biology, 2011, 17(7): 2385-2399. |
| 4 | Wan M W, Liu X Z. Phenological observation methods in China. Beijing: Science Press, 1987. |
| 宛敏渭, 刘秀珍. 中国物候观测方法. 北京: 科学出版社, 1987. | |
| 5 | Verbesselt J, Hyndman R, Culvenor D, et al. Detecting trend and seasonal changes in satellite image time series. Transactions of the Chinese Society of Agricultural Engineering, 2010, 114(1): 106-115. |
| 6 | Chen X Q, Hu B, Yu R. Spatial and temporal variation of phonological growing season and climate change impacts in temperate Eastern China. Global Change Biology, 2005, 11: 1118-1130. |
| 7 | Julien Y, Sobrino J A, Verhoef W. Changes in land surface temperatures and NDVI values over Europe between 1982 and 1999. Remote Sensing of Environment, 2006, 103(1): 43-55. |
| 8 | Sellers P J. Canopy reflectance, photosynthesis and transpiration. International Journal of Remote Sensing, 1985, 6(8): 1335-1372. |
| 9 | Ma X P, Bai H Y, He Y N, et al. The vegetation remote sensing phenology of Qinling Mountains based on NDVI and it’s response to temperature: Taking within the territory of Shanxi as an example. Scientia Geographica Sinica, 2015, 35(12): 1616-1621. |
| 马新萍, 白红英, 贺映娜, 等. 基于NDVI的秦岭山地植被遥感物候及其与气温的响应关系——以陕西境内为例. 地理科学, 2015, 35(12): 1616-1621. | |
| 10 | Li P. Dynamics of vegetation autumn phenology and their response to extremely climate change in the Qinghai-Tibet Plateau. Xianyang: Northwest A & F University, 2017. |
| 李鹏. 青藏高原植被枯黄期的时空变化及其对极端气候事件的响应. 咸阳: 西北农林科技大学, 2017. | |
| 11 | Cihlar J, Ly H, Li Z Q, et al. Multitemporal, multichannel AVHRR data sets for land biosphere studies-artifacts and corrections. Remote Sensing of Environment, 1997, 60: 35-57. |
| 12 | Zhou Z G, Tang P. Ⅵ-quality-based Savitzky-Golay method for filtering time series data. Remote Sensing Technology and Application, 2013, 28(2): 232-239. |
| 周增光, 唐娉. 基于质量权重的Savitzky-Golay时间序列滤波方法. 遥感技术与应用, 2013, 28(2): 232-239. | |
| 13 | Liu J W, Zhou Y K. Comparison and application of NDVI time-series reconstruction methods at site scale on the Tibetan Plateau. Progress in Geography, 2018, 37(3): 427-437. |
| 刘建文, 周玉科. 站点尺度的青藏高原时序NDVI重构方法比较与应用. 地理科学进展, 2018, 37(3): 427-437. | |
| 14 | Gu Z H. Research on remote sensing estimation method of China’s multiple cropping index-based on SPOT/VGT multi-temporal NDVI remote sensing data. Beijing: Beijing Normal University, 2003. |
| 辜智慧. 中国农作物复种指数的遥感估算方法研究——基于SPOT/VGT多时相NDVI遥感数据.北京: 北京师范大学, 2003. | |
| 15 | Liu Y N, Xiao F, Du Y. Analysis of four time series EVI data reconstruction methods. Acta Ecologica Sinica, 2016, 36(15): 4672-4679. |
| 刘亚南, 肖飞, 杜耘. 基于秦岭样区的4种时序EVI函数拟合方法对比研究. 生态学报, 2016, 36(15): 4672-4679. | |
| 16 | Zhang X Y, Friedl M A, Schaaf C B, et al. Monitoring vegetation phenology using MODIS. Remote Sensing of Environment, 2003, 84: 471-475. |
| 17 | Xiao W W, Sun Z G, Wang Q X, et al. Evaluating MODIS phenology product for rotating croplands through ground observations. Journal of Applied Remote Sensing, 2013, 7(1): 609-618. |
| 18 | Begue A, Vintrou E, Saad A, et al. Differences between cropland and rangeland MODIS phenology (start-of-season) in Mali. International Journal of Applied Earth Observation & Geoinformation, 2014, 31(1): 167-170. |
| 19 | Delbart N, Toan T L, Kergoat L, et al. Remote sensing of spring phenology in boreal regions: A free of snow-effect method using NOAA-AVHRR and SPOT-VGT data (1982-2004). Remote Sensing of Environment, 2006, 101(1): 52-62. |
| 20 | Zeng H, Jia G, Epstein H. Recent changes in phenology over the northern high latitudes detected from multi-satellite data. Environmental Research Letters, 2011, 6(4): 45508-45518. |
| 21 | Wang H, Li X B, Ying G, et al. The variability of vegetation growing season in the northern China based on NOAA NDVI and MSAVI from 1982 to 1999. Acta Ecologica Sinica, 2007, 27(2): 504-515. |
| 王宏, 李晓兵, 莺歌, 等. 基于NOAANDVI和MSAVI研究中国北方植被生长季变化. 生态学报, 2007, 27(2): 504-515. | |
| 22 | Ni L, Wu J, Li C B, et al. Temporal and spatial variations in natural grassland phenology in China over the last 30 years. Acta Prataculturae Sinica, 2020, 29(1): 1-12. |
| 倪璐, 吴静, 李纯斌, 等. 近30年中国天然草地物候时空变化特征分析. 草业学报, 2020, 29(1): 1-12. | |
| 23 | He B Z, Ding J L, Li H, et al. Spatiotemporal variation of vegetation phenology in Xinjiang from 2001 to 2016. Acta Ecologica Sinica, 2018, 38(6): 2139-2155. |
| 何宝忠, 丁建丽, 李焕, 等. 新疆植被物候时空变化特征. 生态学报, 2018, 38(6): 2139-2155. | |
| 24 | Zhang R P, Guo J, Feng Q S, et al. Spatio-temporal variations in grassland vegetation phenology in Xinjiang. Acta Prataculturae Sinica, 2018, 27(10): 66-75. |
| 张仁平, 郭靖, 冯琦胜, 等. 新疆地区草地植被物候时空变化. 草业学报, 2018, 27(10): 66-75. | |
| 25 | Savitzky A, Golay M J E. Smoothing and differentiation of data by simplified least squares procedures. Analytical Chemistry, 1964, 36(8): 1627-1639. |
| 26 | Jonsson P, Eklundh L. Seasonality extraction by function fitting to time-series of satellite sensor data. IEEE Transaction on Geoscience and Remote Sensing, 2002, 40(8): 1824-1832. |
| 27 | Beck P, Atzberer C, Hogda K, et al. Improved monitoring of vegetation dynamics at very high latitudes: A new method using MODIS NDVI. Remote Sensing of Environment, 2006, 100(3): 321-334. |
| 28 | Xia C F, Li J, Liu Q H. Review of advance in vegetation phenology monitoring by remote sensing. Journal of Remote Sensing, 2013, 17(1): 1-16. |
| 夏传福, 李静, 柳钦火. 植被物候遥感监测研究进展. 遥感学报, 2013, 17(1): 1-16. | |
| 29 | Ma Y G, Zhang C, Tiiyip Tashpolat. Spatial-temporal change of land surface phenology in Central Asia arid zone. Arid Land Geography, 2014, 37(2): 310-317. |
| 马勇刚, 张弛, 塔西甫拉提·特依拜. 中亚区域陆表植被物候时空变化特征分析. 干旱区地理, 2014, 37(2): 310-317. | |
| 30 | Li D K, Wang Z. Spatiotemporal variation of vegetation phenology and its response to climate in Qinling Mountains based on MCD12Q2. Ecology and Environment Sciences, 2020, 29(1): 11-22. |
| 李登科, 王钊. 基于MCD12Q2的秦岭植被物候时空变化及对气候的响应. 生态环境学报, 2020, 29(1): 11-22. | |
| 31 | Wu N T, Liu G X, Yang Y, et al. Dynamic monitoring of net primary productivity and its response to climate factors in native grassland in Inner Mongolia using a light-use efficiency model. Acta Prataculturae Sinica, 2020, 29(11): 1-10. |
| 乌尼图, 刘桂香, 杨勇, 等. 基于光能利用率模型的内蒙古天然草原植被净初级生产力动态监测与气候因子的响应. 草业学报, 2020, 29(11): 1-10. | |
| 32 | Zhang C, Yan H F, Takase K, et al. Comparison of the soil physical properties and hydrological processes in two different forest type catchments. Water Resources, 2016, 43(1): 225-237. |
| 33 | Huang S. Parametrization of resistances for modeling crop transpiration and soil evaporation in the Southern Jiangsu. Zhenjiang: Jiangsu University, 2020. |
| 黄松. 苏南地区典型作物蒸腾和土面蒸发模型及参数的研究. 镇江: 江苏大学, 2020. | |
| 34 | Wang Y Y, Yuan J G, Zhang Y, et al. Temporal and spatial variation of vegetation phenology in temperate China and its impact on gross primary productivity. Remote Sensing Technology and Application, 2019, 34(2): 377-388. |
| 王莹莹, 袁金国, 张莹, 等. 中国温带地区植被物候期时空变化特征及对总初级生产力的影响. 遥感技术与应用, 2019, 34(2): 377-388. | |
| 35 | Wen G, Fu C B. Large scale features of the seasonal phenological responses to the monsoon climate in East China: Multi-year average results. Chinese Journal of Atmospheric Sciences, 2000, 24(5): 676-683. |
| 温刚, 符淙斌. 中国东部季风区植被物候季节变化对气候响应的大尺度特征: 多年平均结果. 大气科学, 2000, 24(5): 676-683. | |
| 36 | An Y Z. Vegetation NDVI and phenology change in Northern China based remote sensing. Shanghai: East China Normal University, 2014. |
| 安佑志. 基于遥感的中国北部植被NDVI和物候变化研究. 上海: 华东师范大学, 2014. | |
| 37 | Piao S L, Cui M D, Chen A P, et al. Altitude and temperature dependence of change in the spring vegetation green-up data from 1982 to 2006 in the Qinghai-Xizang Plateau. Agriculture and Forest Meteorology, 2011, 151(12): 1599-1608. |
| 38 | Zhang W, Bao G, Bao Y H. Vegetation SOS dynamic monitoring in Inner Mongolia from 1982 to 2013 and its responses to climate changes. China Agricultural Informatics, 2018, 30(2): 63-75. |
| 张雯, 包刚, 包玉海. 1982-2013年内蒙古植被返青期动态监测及其对气候变化的响应. 中国农业信息, 2018, 30(2): 63-75. |
| [1] | 杨鑫, 曹文侠, 鱼小军, 汪海斌, 郝媛媛. 基于近20年MODIS NDVI日数据的青海省草地资源动态监测及其对环境因子的响应[J]. 草业学报, 2021, 30(9): 1-14. |
| [2] | 吴廷美, 林慧龙, 范迪, 籍常婷, 赵玉婷, 魏靖琼. 冻原高山草地牧户家畜养殖规模影响因素分析——以青海省为例[J]. 草业学报, 2021, 30(9): 117-126. |
| [3] | 刘佳丽, 范建容, 张茜彧, 杨超, 徐富宝, 张晓雪, 梁博. 高寒草地生长季/非生长季植被盖度遥感反演[J]. 草业学报, 2021, 30(9): 15-26. |
| [4] | 宋梅玲, 王玉琴, 王宏生, 鲍根生. 内生真菌对高寒草地紫花针茅凋落物分解的影响[J]. 草业学报, 2021, 30(9): 150-158. |
| [5] | 付刚, 王俊皓, 李少伟, 何萍. 藏北高寒草地牧草营养品质对放牧的响应机制[J]. 草业学报, 2021, 30(9): 38-50. |
| [6] | 赵京东, 乌云娜, 宋彦涛. 短期围封对辽西北退化草地群落牧草品质的影响[J]. 草业学报, 2021, 30(9): 51-61. |
| [7] | 林慧龙, 蒲彦妃, 王丹妮, 马海丽. 草原指数保险:评述与中国方案设计[J]. 草业学报, 2021, 30(8): 171-185. |
| [8] | 马婧婧, 刘耘华, 盛建东, 李宁, 武红旗, 贾宏涛, 孙宗玖, 程军回. 新疆草地优势种植物相对生物量沿海拔梯度变化特征[J]. 草业学报, 2021, 30(8): 25-35. |
| [9] | 赵京东, 宋彦涛, 徐鑫磊, 乌云娜. 施氮和刈割对辽西北退化草地牧草产量和品质的影响[J]. 草业学报, 2021, 30(8): 36-48. |
| [10] | 林小丁, 常乐, 冯丹. 2000-2019年青海地区植被总初级生产力遥感估算及时空变化分析[J]. 草业学报, 2021, 30(6): 16-27. |
| [11] | 孙忠超, 郭天斗, 于露, 马彦平, 赵亚楠, 李雪颖, 王红梅. 宁夏东部荒漠草原向灌丛地人为转变过程土壤粒径分形特征[J]. 草业学报, 2021, 30(4): 34-45. |
| [12] | 张金青, 牛奎举, 李玉珠, 马晖玲. 植物无融合生殖发生因素解析及其在草地早熟禾育种中的应用前景展望[J]. 草业学报, 2021, 30(4): 205-217. |
| [13] | 张茹, 李建平, 彭文栋, 王芳, 李志刚. 柠条枝条覆盖对宁夏荒漠草原土壤水热及补播牧草生物量的影响[J]. 草业学报, 2021, 30(4): 58-67. |
| [14] | 张超, 闫瑞瑞, 梁庆伟, 娜日苏, 李彤, 杨秀芳, 包玉海, 辛晓平. 不同利用方式下草地土壤理化性质及碳、氮固持研究[J]. 草业学报, 2021, 30(4): 90-98. |
| [15] | 王辛有, 曹文侠, 王小军, 刘玉祯, 高瑞, 王世林, 安海涛, 邓秀霞, 王文虎. 河西地区豆禾混播草地生产性能对刈割高度与施肥的响应[J]. 草业学报, 2021, 30(4): 99-110. |
| 阅读次数 | ||||||
|
全文 |
|
|||||
|
摘要 |
|
|||||