

ISSN 1004-5759 CN 62-1105/S
草业学报 ›› 2024, Vol. 33 ›› Issue (2): 57-67.DOI: 10.11686/cyxb2023166
陈嘉慧( ), 刘文献()
收稿日期:2023-05-17
修回日期:2023-07-05
出版日期:2024-02-20
发布日期:2023-12-12
通讯作者:
刘文献
作者简介:E-mail: liuwx@lzu.edu.cn基金资助:
Jia-hui CHEN(), Wen-xian LIU()
Received:2023-05-17
Revised:2023-07-05
Online:2024-02-20
Published:2023-12-12
Contact:
Wen-xian LIU
摘要:
随着高通量测序技术的快速发展,多种牧草的基因组和转录组的测序数据相继公布,生物科学已经进入了后基因组时代;基因组学的研究重心也从基因组的结构转向基因功能的挖掘和验证层次,而基因在不同组织的表达量对基因功能挖掘具有重要指导作用。在先前的研究中,育种科学家经常通过柱状图、表格或普通热图等形式对不同组织间的表达量数据进行展示。但这些展示方法形式较为单一,且结果不够美观,读者难以快速有效地获取相关信息。为了更加直观、美观、全面地展示组学数据,本研究以TBtools软件为基础,以紫花苜蓿、蒺藜苜蓿、羊草、黄花草木樨等10种重要牧草为研究对象,结合Adobe Illustrator绘制的SVG文件,构建了一套牧草组学数据可视化工作流程,并以紫花苜蓿中MsSAP基因的表达模式以及不同逆境胁迫下基因的表达模式等为例,从数据获取、热图绘制以及结果展示等方面进行详细介绍。通过与传统的图形展示方式相比较,结果发现,利用本研究提供的牧草SVG图形文件以及可视化流程对多组学数据进行可视化,科研人员能够更快速、高效、美观地展示自己的多组学研究结果,从而为后续深入挖掘功能基因及功能验证提供指导。
陈嘉慧, 刘文献. 重要牧草组学数据图形可视化展示工具的构建及应用[J]. 草业学报, 2024, 33(2): 57-67.
Jia-hui CHEN, Wen-xian LIU. Construction and application of a graphic visualization tool for important forage omics data[J]. Acta Prataculturae Sinica, 2024, 33(2): 57-67.

图1 用于绘制SVG图片的10个物种参考图
Fig.1 10 species reference maps for drawing SVG images
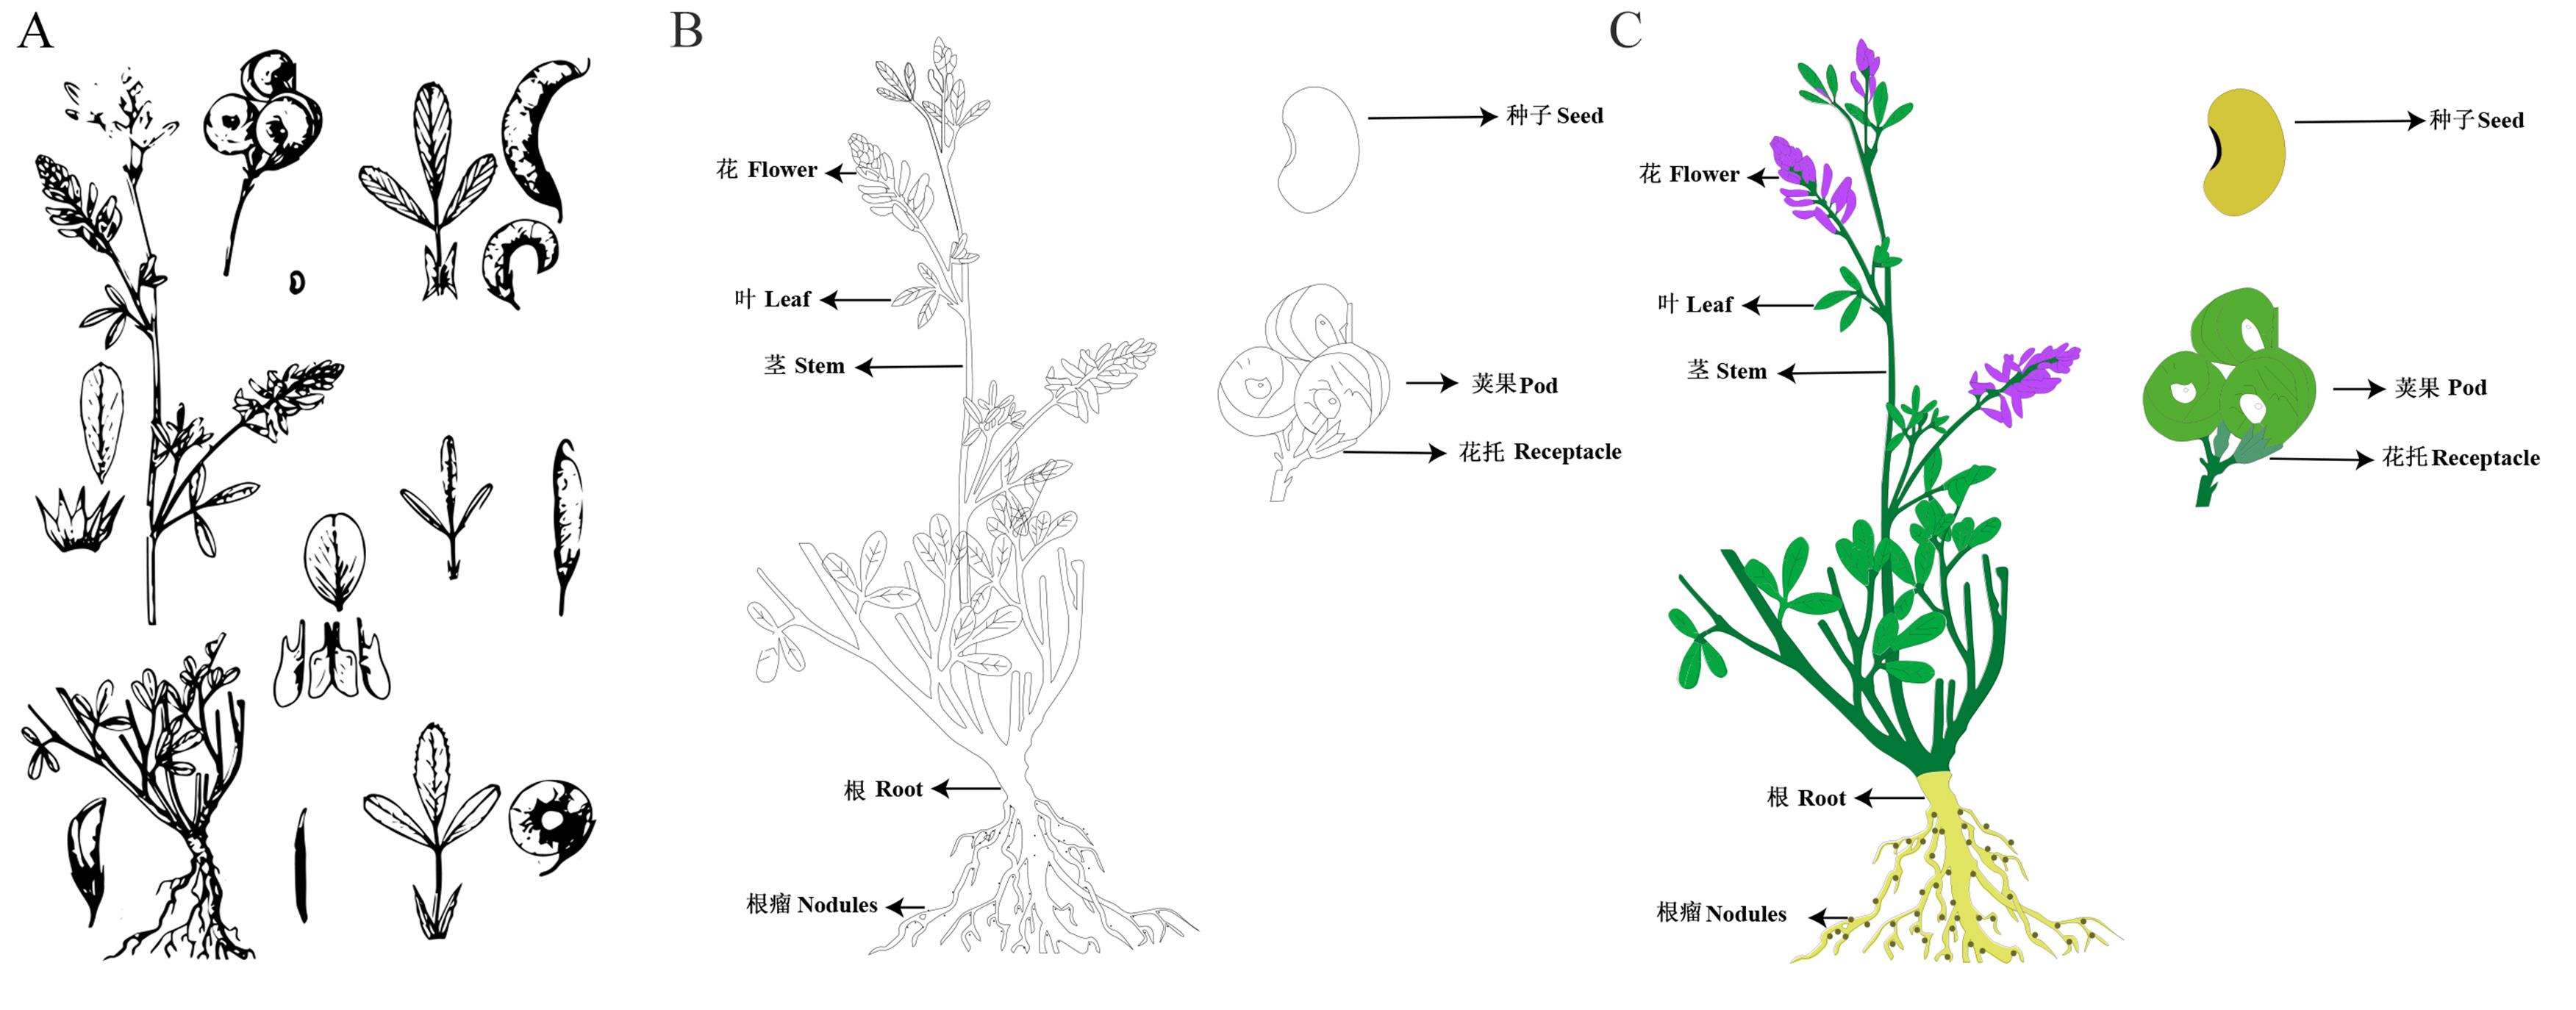
图2 紫花苜蓿SVG图绘制过程A, 紫花苜蓿参考图进行图像描摹结果;B, 钢笔工具勾勒紫花苜蓿线图;C, 紫花苜蓿SVG图实时上色。A, Alfalfa reference diagram for image tracing results; B, Pen tool to outline the alfalfa line diagram; C, Alfalfa SVG diagram coloring in real time.
Fig.2 The process of drawing SVG diagram of alfalfa

图3 10种牧草SVG图绘制结果
Fig.3 Results of SVG image generation for ten forage grasses
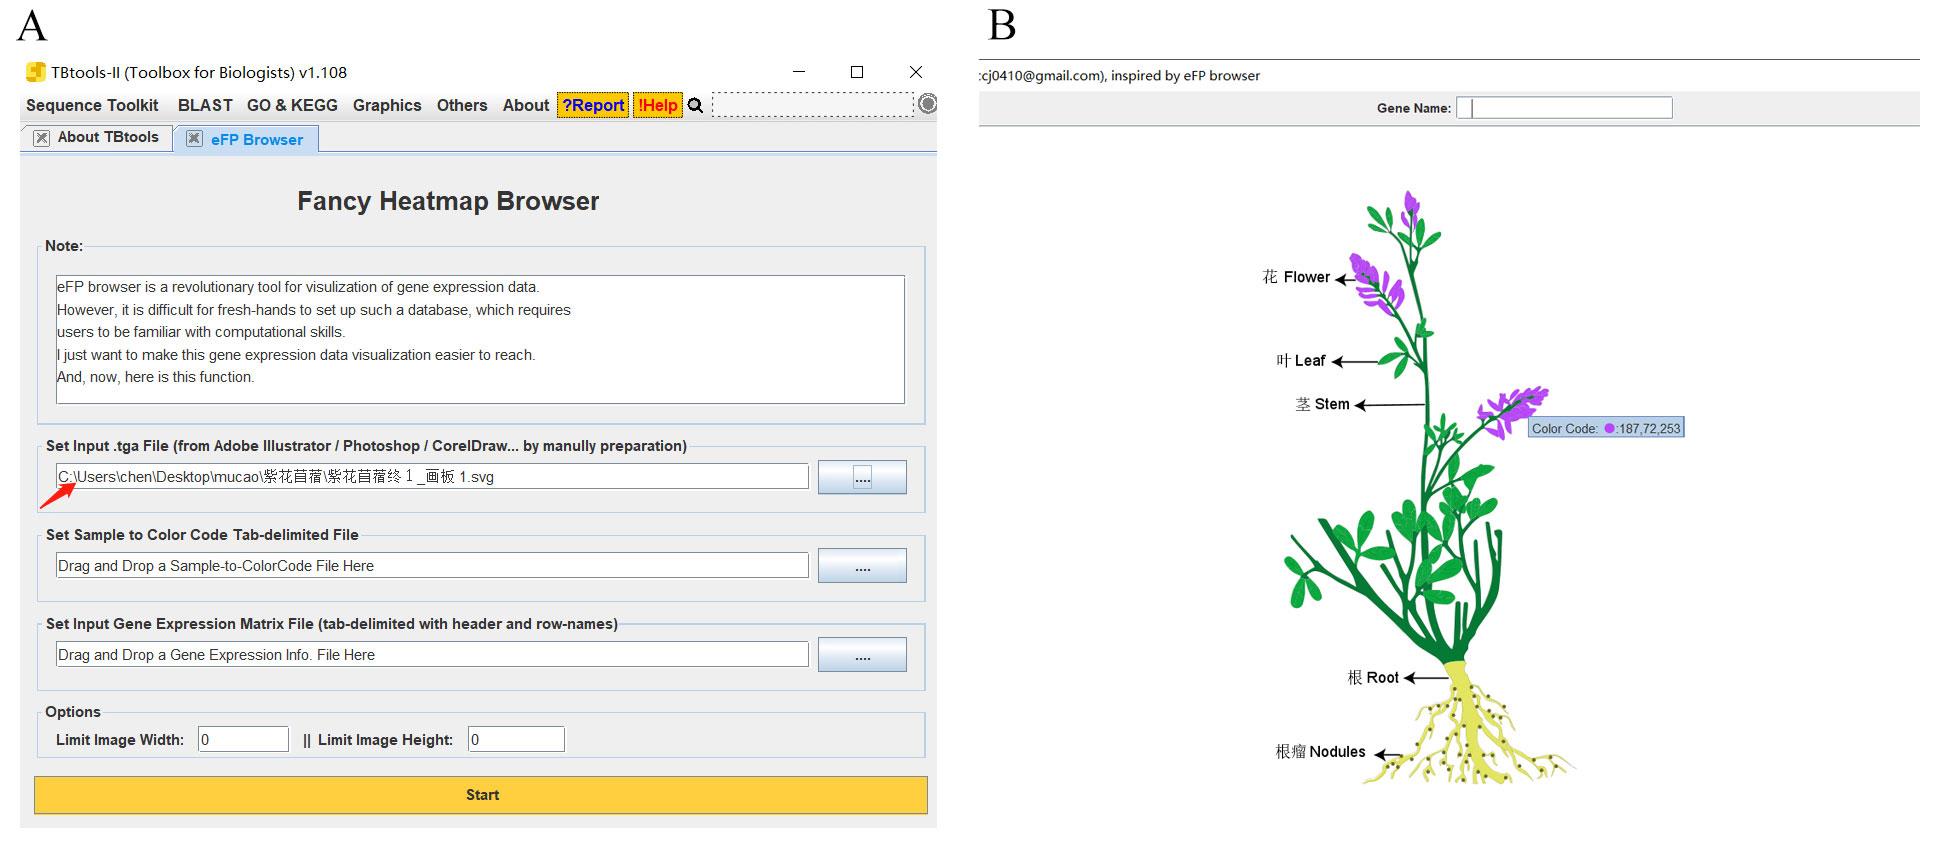
图4 颜色代码的获得A, SVG图输入eFP Browsers界面;B, 获取颜色代码的界面。A, Interface for SVG image input; B, Interface for obtaining color codes.
Fig.4 Acquisition of color code
| 器官Organ | 颜色代码Color code |
|---|---|
| 花Flower | 187,72,253 |
| 叶Leaf | 0,168,64 |
| 根瘤Nodule | 107,105,44 |
| 根Root | 225,228,98 |
表 1 用于热图绘制的颜色代码
Table 1 Color code for heatmap generation
| 器官Organ | 颜色代码Color code |
|---|---|
| 花Flower | 187,72,253 |
| 叶Leaf | 0,168,64 |
| 根瘤Nodule | 107,105,44 |
| 根Root | 225,228,98 |
基因名称 Gene ID | 花 Flower | 叶 Leaf | 根瘤 Nodule | 根 Root |
|---|---|---|---|---|
| MsSAP7/13 | 9 | 5 | 7 | 13 |
| MsSAP14 | 53 | 41 | 32 | 38 |
| MsSAP6/18 | 76 | 36 | 23 | 55 |
| MsSAP8/10/12 | 0 | 0 | 1 | 0 |
| MsSAP19/20 | 38 | 46 | 38 | 51 |
| MsSAP21/22 | 2 | 0 | 0 | 0 |
表 2 紫花苜蓿不同组织的表达矩阵
Table 2 Expression matrix of different tissues of alfalfa
基因名称 Gene ID | 花 Flower | 叶 Leaf | 根瘤 Nodule | 根 Root |
|---|---|---|---|---|
| MsSAP7/13 | 9 | 5 | 7 | 13 |
| MsSAP14 | 53 | 41 | 32 | 38 |
| MsSAP6/18 | 76 | 36 | 23 | 55 |
| MsSAP8/10/12 | 0 | 0 | 1 | 0 |
| MsSAP19/20 | 38 | 46 | 38 | 51 |
| MsSAP21/22 | 2 | 0 | 0 | 0 |

图5 eFP Browers界面
Fig.5 Interface of eFP Browers
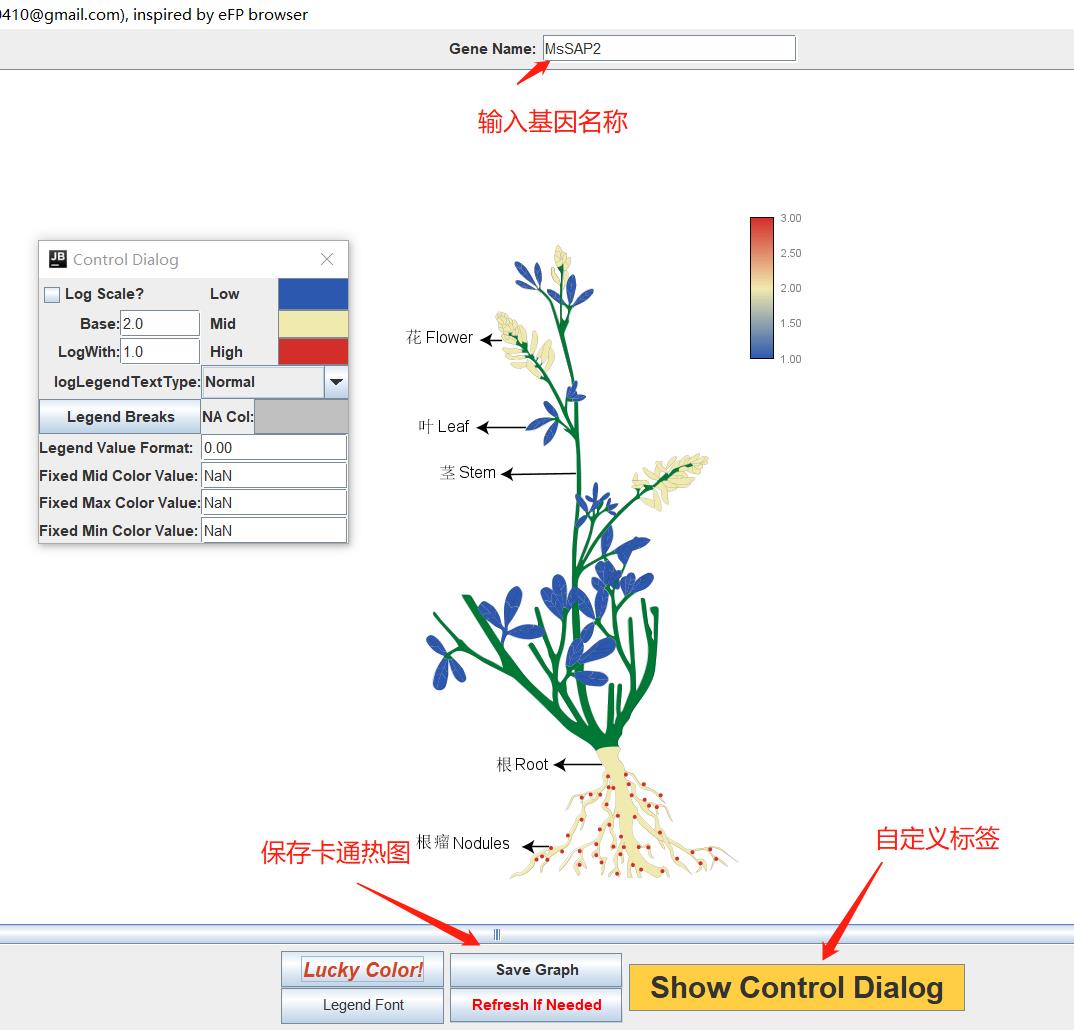
图6 TBtools绘制卡通热图结果输出界面
Fig.6 TBtools cartoon heatmap result output interface

图7 紫花苜蓿SAP成员组织表达模式分析A: eFP Browsers绘制的基因表达模式图;B: Origin绘制的柱状图。A: Gene expression pattern plotted by eFP Browsers; B: Histogram plotted by Origin.
Fig.7 Analysis of the tissue expression pattern of alfalfa SAP members

图8 不同时长铝胁迫处理根系基因表达量TPM:基因表达量值Transcripts per million.
Fig.8 Gene expression in root systems treated with different durations of aluminum stress
| 1 | Guo T, Bai J, Wang J G. Research on the present situation and countermeasures of alfalfa grass industry in China. Chinese Journal of Grassland, 2018, 40(4): 111-115. |
| 郭婷, 白娟, 王建国. 刍议我国苜蓿草产业发展现状与对策. 中国草地学报, 2018, 40(4): 111-115. | |
| 2 | Jin J B, Wang T, Cheng Y F, et al. Current situation and prospect of forage breeding in China. Bulletin of Chinese Academy of Sciences, 2021, 36(6): 660-665. |
| 金京波, 王台, 程佑发, 等. 我国牧草育种现状与展望.中国科学院院刊, 2021, 36(6): 660-665. | |
| 3 | Liu Z P, Zhou Q, Liu W X, et al. Some scientific issues of forage breeding in China. Acta Prataculturae Sinica, 2021, 30(12): 184-193. |
| 刘志鹏, 周强, 刘文献, 等. 中国牧草育种中的若干科学问题. 草业学报, 2021, 30(12): 184-193. | |
| 4 | Zhang S, Wang C. Transcriptome profiling of gene expression in fall dormant and nondormant alfalfa. Genomics Data, 2014, 2: 282-284. |
| 5 | Wan L, Li Y, Li S, et al. Transcriptomic profiling revealed genes involved in response to drought stress in alfalfa. Journal of Plant Growth Regulation, 2022, 41(1): 92-112. |
| 6 | Zhao J Y. Genome sequencing and assemble analysis of Medicago sativa. Harbin: Harbin Normal University, 2019. |
| 赵金月. 紫花苜蓿基因组测序及分析. 哈尔滨: 哈尔滨师范大学, 2019. | |
| 7 | Song J, Mao H, Cheng J, et al. Identification of the trehalose-6-phosphate synthase gene family in Medicago truncatula and expression analysis under abiotic stresses. Gene, 2021, 787(575): 145641. |
| 8 | Branca A, Paape T D, Zhou P, et al. Whole-genome nucleotide diversity, recombination, and linkage disequilibrium in the model legume Medicago truncatula. Proceedings of the National Academy of Sciences, 2011, 108(42): e864-e870. |
| 9 | Wu F, Duan Z, Xu P, et al. Genome and systems biology of Melilotus albus provides insights into coumarins biosynthesis. Plant Biotechnology Journal, 2022, 20(3): 592-609. |
| 10 | Ma Q, Bao A K, Chai W W, et al. Transcriptomic analysis of the succulent xerophyte Zygophyllum xanthoxylum in response to salt treatment and osmotic stress. Plant and Soil, 2016, 402(1/2): 343-361. |
| 11 | Abeynayake S W, Byrne S, Nagy I, et al. Changes in Lolium perenne transcriptome during cold acclimation in two genotypes adapted to different climatic conditions. BMC Plant Biology, 2015, 15(1): 250. |
| 12 | Diekmann K, Hodkinson T R, Wolfe K H, et al. Complete chloroplast genome sequence of a major allogamous forage species, perennial ryegrass (Lolium perenne L.). DNA Research, 2009, 16(3): 165-176. |
| 13 | Li X, Liu S, Yuan G, et al. Comparative transcriptome analysis provides insights into the distinct germination in sheepgrass (Leymus chinensis) during seed development. Plant Physiology and Biochemistry, 2019, 139: 446-458. |
| 14 | Sun Y, Wang F, Wang N, et al. Transcriptome exploration in Leymus chinensis under saline-alkaline treatment using 454 pyrosequencing. PLoS One, 2013, 8(1): e53632. |
| 15 | Peng Y, Yan H, Guo L, et al. Reference genome assemblies reveal the origin and evolution of allohexaploid oat. Nature Genetics, 2022, 54(8): 1248-1258. |
| 16 | Ma L, Wang X, Yan M, et al. Genome survey sequencing of common vetch (Vicia sativa L.) and genetic diversity analysis of Chinese germplasm with genomic SSR markers. Molecular Biology Reports, 2022, 49(1): 313-320. |
| 17 | Patrick S S, Doreen W, Robert S F, et al. The b73 maize genome: Complexity, diversity, and dynamics. Science, 2009, 326(5956): 1112-1115. |
| 18 | Zhao Y Q. Screening of low seed-shattering germplasm and identification of candidate genes for seed shattering in Elymus nutans. Lanzhou: Lanzhou University, 2019. |
| 赵永强. 垂穗披碱草低落粒种质筛选及落粒候选基因挖掘. 兰州: 兰州大学, 2019. | |
| 19 | Liu R J, Lu X W, Dou Q W. Development of SSR markers in Elymus nutans based on reduced-representation genome sequencing. Molecular Plant Breeding, 2018, 16(6): 1888-1894. |
| 刘瑞娟, 路兴旺, 窦全文. 基于简化基因组测序开发垂穗披碱草(Elymus nutans)SSR标记. 分子植物育种, 2018, 16(6): 1888-1894. | |
| 20 | Winter D, Vinegar B, Nahal H, et al. An “Electronic Fluorescent Pictograph” browser for exploring and analyzing large-scale biological data sets. PLoS One, 2007, 2(8): e718. |
| 21 | Hawkins C, Caruana J, Li J, et al. An eFP browser for visualizing strawberry fruit and flower transcriptomes. Horticulture Research, 2017, 4(1): 17029. |
| 22 | Sateesh K, John N, Yogendra K, et al. The developmental transcriptome atlas of the biofuel crop Camelina sativa. The Plant Journal: for Cell and Molecular Biology, 2016, 88(5): 879-894. |
| 23 | Waese J, Fan J, Pasha A, et al. ePlant: Visualizing and exploring multiple levels of data for hypothesis generation in plant biology. Plant Cell, 2017, 29(8): 1806-1821. |
| 24 | Mao Q, Chen C J, Xie T, et al. Comprehensive tissue-specific transcriptome profiling of pineapple (Ananas comosus) and building an eFP-browser for further study. PeerJ, 2018, 6: e6028. |
| 25 | Brian L, Warren B, Mcatee P, et al. A gene expression atlas for kiwifruit (Actinidia chinensis) and network analysis of transcription factors. BMC Plant Biology, 2021, 21(1): 121. |
| 26 | Wang Q X. Functional analysis of alfalfa SAP22 gene in response to drought stress. Lanzhou: Lanzhou University, 2022. |
| 王秋霞. 紫花苜蓿SAP22基因响应干旱胁迫功能分析. 兰州: 兰州大学, 2022. | |
| 27 | Yang Y C. Analysis of SVG format image file and its application in construction of public library website. Computer Era, 2021(11): 34-37. |
| 杨义臣. 浅析SVG格式图像文件及其在公共图书馆网站建设中的应用. 计算机时代, 2021(11): 34-37. | |
| 28 | Shi S P, Zhang Y M, Yang S L, et al. Construction of electronic map display module of ocean liner based on SVG format. Marine Technology, 2022, 50(4): 48-52. |
| 石粟萍, 张怡敏, 杨山林, 等. 基于SVG格式的远洋客船电子地图显示模块构建. 造船技术, 2022, 50(4): 48-52. | |
| 29 | Jing H C, Wang T, Lin R C, et al. Strengthen the research of forage basic biology to ensure forage seed industry and national food security. Bulletin of Botany, 2022, 57(6): 719-724. |
| 景海春, 王台, 林荣呈, 等. 加强饲草基础生物学研究, 保障饲草种业与国家大粮食安全. 植物学报, 2022, 57(6): 719-724. | |
| 30 | Fang Y H, Nan W B, Liang Y S, et al. Plant tissue-specific gene expression system and its application. Plant Physiology Journal, 2015, 51(6): 797-805. |
| 方彦昊, 南文斌, 梁永书, 等. 植物组织特异性基因表达技术及其应用. 植物生理学报, 2015, 51(6): 797-805. | |
| 31 | Pattison R J, Csukasi F, Zheng Y, et al. Comprehensive tissue-specific transcriptome analysis reveals distinct regulatory programs during early tomato fruit development. Plant Physiology, 2015, 168(4): 1684-1701. |
| 32 | Chowdhury S, Mukherjee A, Basak S, et al. Disruption of tomato TGS machinery by ToLCNDV causes reprogramming of vascular tissue-specific TORNADO1 gene expression. Planta, 2022, 256(4): 78. |
| 33 | Yu T T, Xu A F, Zhang J L, et al. Gene identification and organ expression characteristics of SHR subfamily in Malus domestica. Journal of Shandong Agricultural University (Natural Science Edition), 2022, 53(3): 346-354. |
| 于婷婷, 许阿飞, 张佳林, 等. 苹果SHR亚家族基因特征及其器官表达谱分析. 山东农业大学学报(自然科学版), 2022, 53(3): 346-354. |
| [1] | 周梦鸽, 李永华. 基于DPSIR模型的牧草产品质量安全评价指标体系构建及应用[J]. 草业学报, 2024, 33(2): 13-27. |
| [2] | 张永亮, 滕泽, 郝凤, 于铁峰, 张玉霞. 苜蓿混播方式及比例对混播草地生产力和稳定性的影响[J]. 草业学报, 2024, 33(2): 185-197. |
| [3] | 张睿, 韩重阳, 蔡家邦, 汪阳, 黄琳凯, 张新全, 聂刚. 6个苇状羊茅(型)品种在成都平原区的生产性能评价[J]. 草业学报, 2024, 33(1): 138-148. |
| [4] | 管瑾, 郭一荻, 刘凌云, 尹淑霞, 滕珂. 结缕草叶肉细胞原生质体瞬时基因表达系统的构建[J]. 草业学报, 2023, 32(7): 61-71. |
| [5] | 叶雪玲, 甘圳, 万燕, 向达兵, 邬晓勇, 吴琪, 刘长英, 范昱, 邹亮. 饲用燕麦育种研究进展与展望[J]. 草业学报, 2023, 32(2): 160-177. |
| [6] | 王占军, 季波, 纪童, 蒋齐. 5种豆科牧草抗旱性研究与评价[J]. 草业学报, 2023, 32(10): 187-199. |
| [7] | 陶奇波, 郄西虎, 张倩, 高宇轩, 张亚锜, 张瑞真, 陈晓菲, 牛天秀, 孙小同, 聂宇婷, 刘雅如, 胡珈齐, 钟尚志, 孙娟. 牧草种子活力评价方法研究进展[J]. 草业学报, 2023, 32(10): 200-225. |
| [8] | 刘牧野, 郭丽珠, 岳跃森, 武菊英, 范希峰, 肖国增, 滕珂. 干旱胁迫下不同性别野牛草生理及抗氧化酶基因表达差异[J]. 草业学报, 2023, 32(10): 93-103. |
| [9] | 许浩宇, 赵颖, 阮倩, 朱晓林, 王宝强, 魏小红. 不同混合盐碱下藜麦幼苗的抗性研究[J]. 草业学报, 2023, 32(1): 122-130. |
| [10] | 杨策, 张玉雪, 张鹤, 郑春燕, 朱峰. 牧草混播生态系统功能研究进展[J]. 草业学报, 2022, 31(9): 206-219. |
| [11] | 韩枫, 张志涛, 张鑫, 王建浩, 王浩. 美国公共牧草地法治管理进程的经验借鉴与若干启示[J]. 草业学报, 2022, 31(9): 220-232. |
| [12] | 曾令霜, 李培英, 孙宗玖, 孙晓梵. 两类新疆狗牙根抗旱基因型抗氧化酶保护系统及其基因表达差异分析[J]. 草业学报, 2022, 31(7): 122-132. |
| [13] | 纪童, 蒋齐, 王占军, 季波. 7种禾本科牧草抗旱性研究与评价[J]. 草业学报, 2022, 31(7): 144-156. |
| [14] | 金有顺, 侯扶江. 放牧家畜养分消化率的测定[J]. 草业学报, 2022, 31(5): 200-212. |
| [15] | 赵利清, 郝志刚, 崔笑岩, 彭向永. 赤霉素及其抑制剂调控草地早熟禾生长及赤霉素相关基因表达的研究[J]. 草业学报, 2022, 31(3): 85-91. |
| 阅读次数 | ||||||
|
全文 |
|
|||||
|
摘要 |
|
|||||