

ISSN 1004-5759 CN 62-1105/S
草业学报 ›› 2024, Vol. 33 ›› Issue (10): 28-36.DOI: 10.11686/cyxb2023470
刘立靖( ), 吴静(), 李纯斌, 常秀红
收稿日期:2023-12-04
修回日期:2024-01-31
出版日期:2024-10-20
发布日期:2024-07-15
通讯作者:
吴静
作者简介:Corresponding author. E-mail: wujing@gsau.edu.cn基金资助:
Li-jing LIU(), Jing WU(), Chun-bin LI, Xiu-hong CHANG
Received:2023-12-04
Revised:2024-01-31
Online:2024-10-20
Published:2024-07-15
Contact:
Jing WU
摘要:
基于MODIS实际蒸散量(ET)和潜在蒸散量(PET)反演作物缺水指数(CWSI),研究黄土高原生长季干旱时空变化特征,并用CWSI和植被归一化指数(NDVI)进行偏相关分析以探究生长季内最干旱月份对NDVI的影响。结果表明:1)黄土高原生长季CWSI多年平均值为0.777,处于中度干旱状态,空间分布表现为东南部较轻,西北部较严重的特征,且高程在1200~1700 m区域内的干旱程度最高;2)2001-2020年多年生长季CWSI整体呈显著下降趋势,其中2001年干旱程度最高,2018年干旱程度最低;在整个生长季内,黄土高原在4月的干旱程度最高;8月的干旱程度最低。具体表现为:4-10月,干旱等级从重旱过渡到中旱和轻旱,又从轻旱演变成中旱;3)从植被类型角度分析,荒漠、草原的分布区域属于重旱;草甸、栽培植被、灌丛的分布区域属于中旱;针叶林、阔叶林的分布区域属于轻旱,且不同植被类型在植被生长季的CWSI均呈波动下降趋势。研究结果可为黄土高原地区的生态预警和旱灾预估提供科学依据。
刘立靖, 吴静, 李纯斌, 常秀红. 2001-2020年黄土高原植被生长季干旱的时空分布[J]. 草业学报, 2024, 33(10): 28-36.
Li-jing LIU, Jing WU, Chun-bin LI, Xiu-hong CHANG. Spatial and temporal distributions of drought on the Loess Plateau during the growing seasons of 2001-2020[J]. Acta Prataculturae Sinica, 2024, 33(10): 28-36.
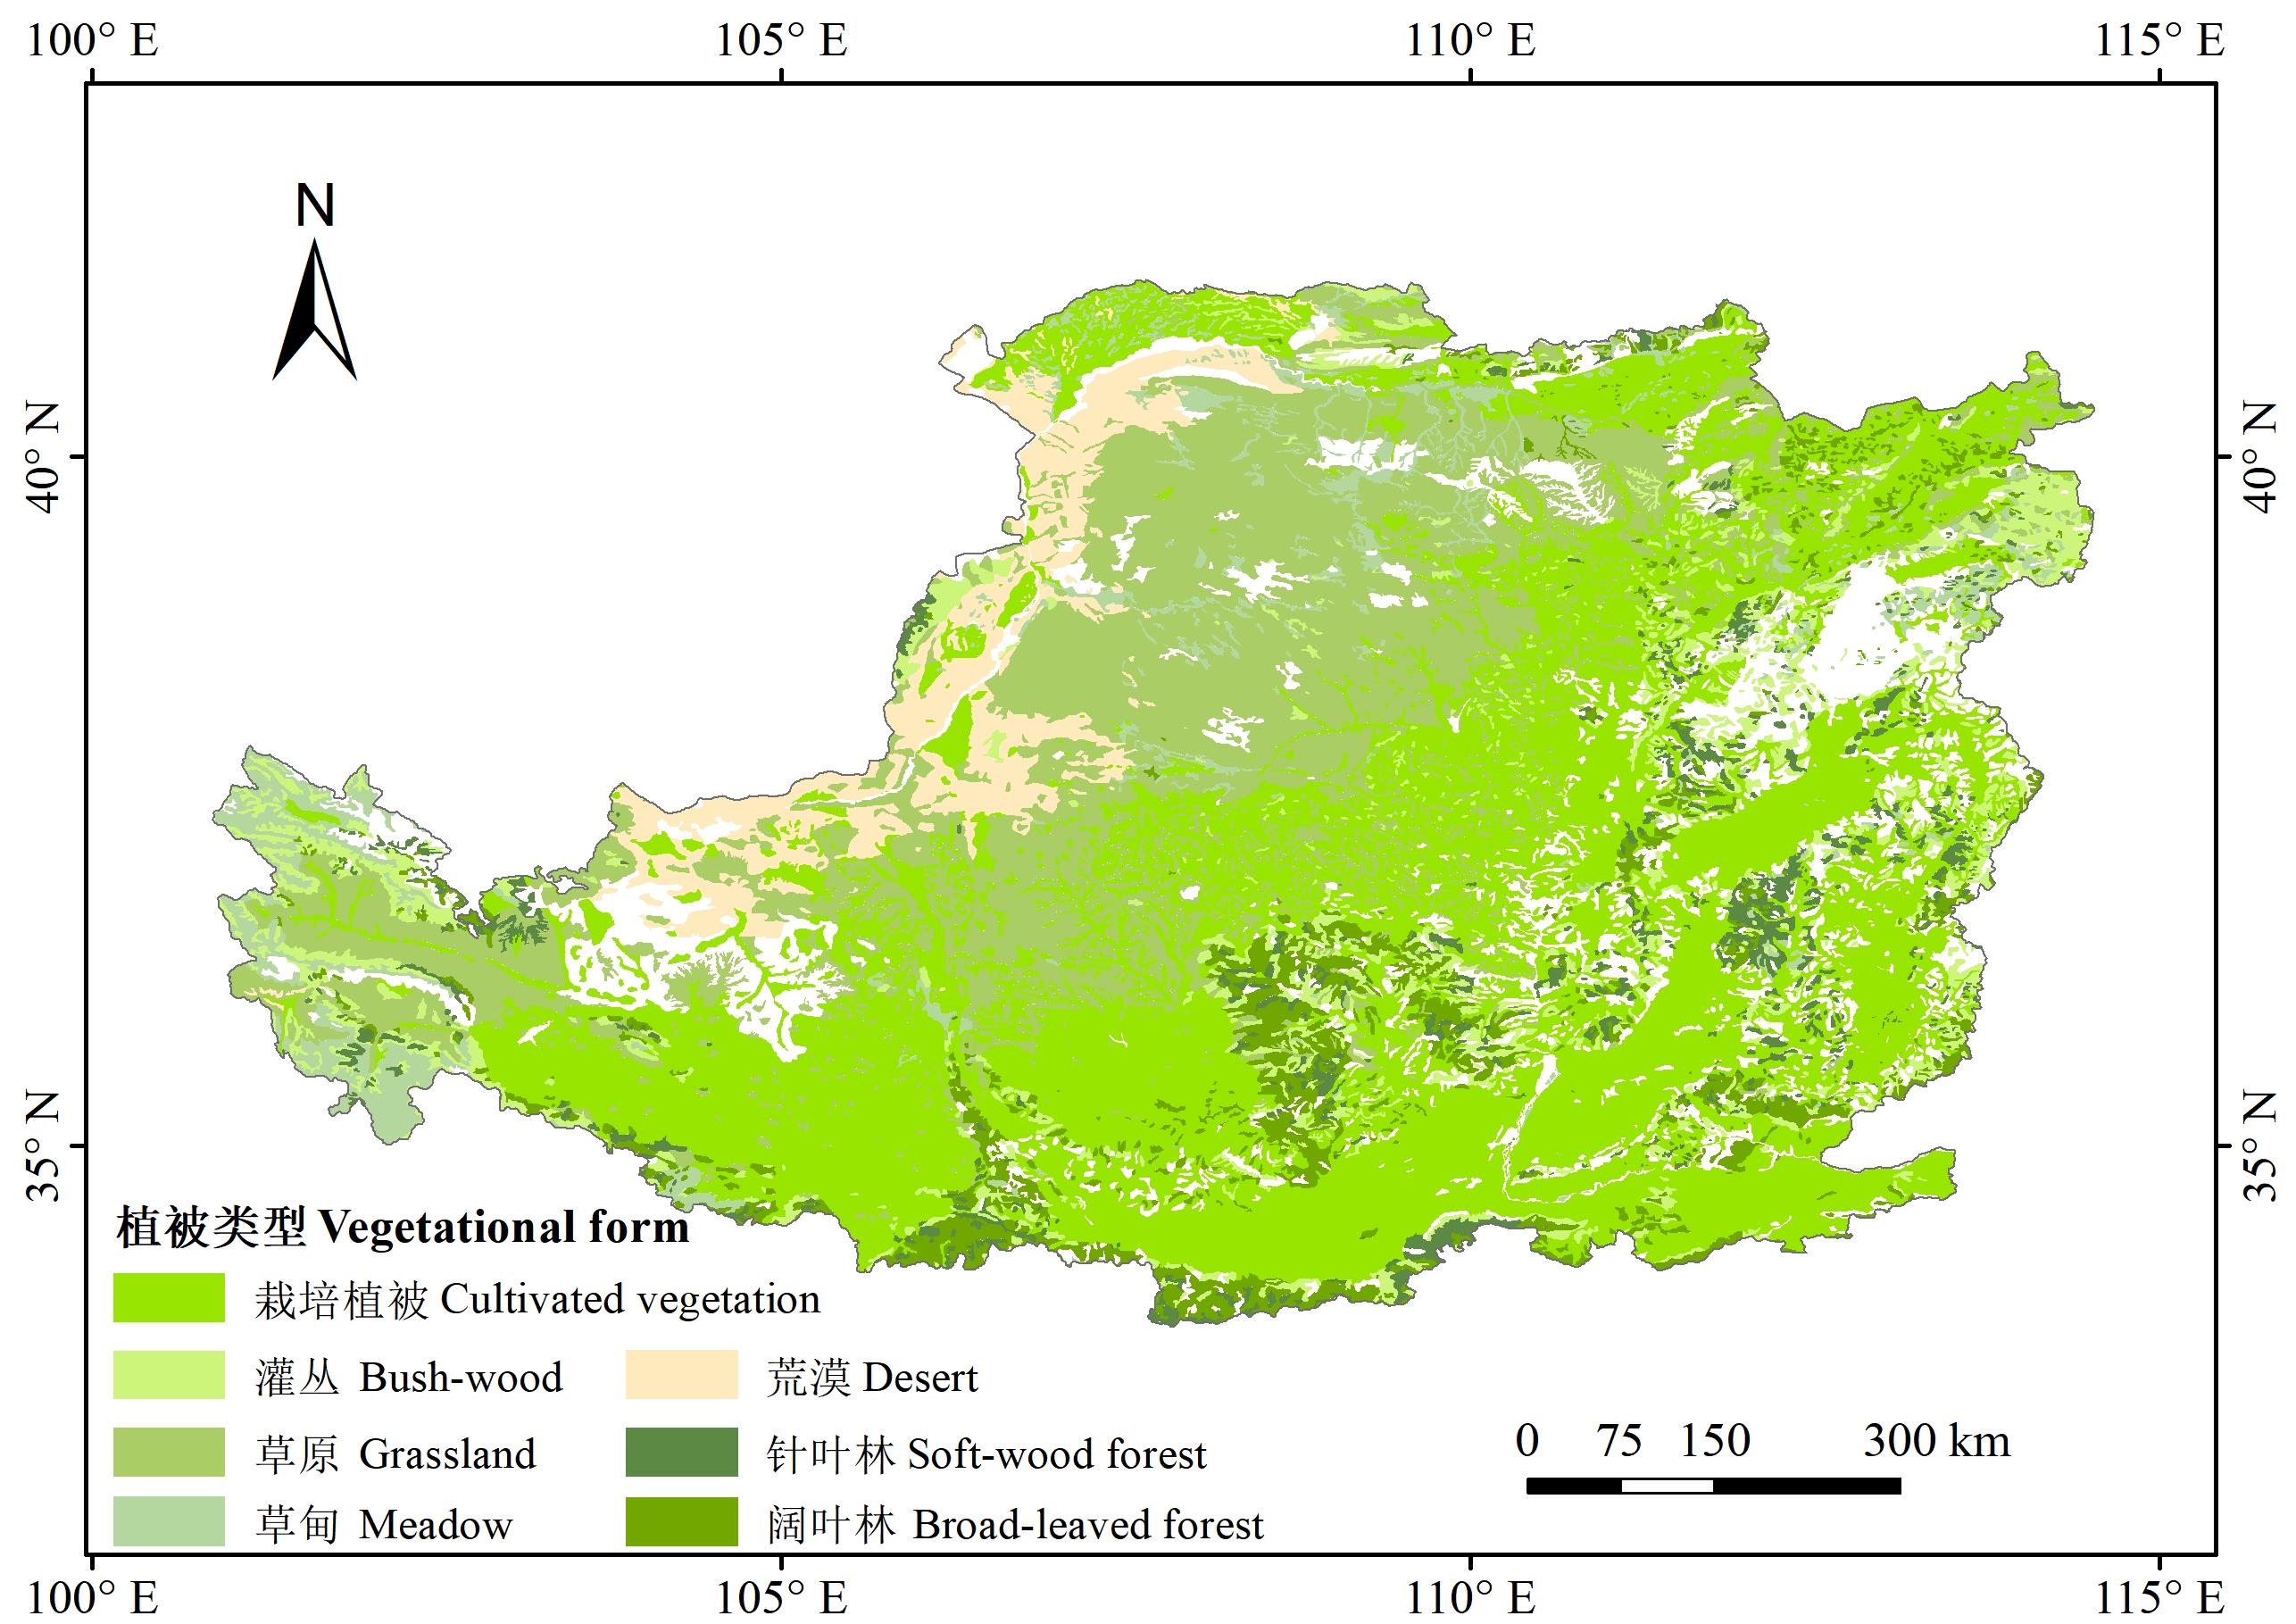
图1 黄土高原植被类型该图基于自然资源部标准地图服务网站GS(2019)1822号标准地图制作,底图边界无修改。Produced based on the Department of Natural Resources standard map service website, standard map No. GS (2019) 1822, with no modifications to the base map boundaries.
Fig. 1 Vegetation types on the Loess Plateau
| 等级 Grade | 作物缺水指数 CWSI | 类型 Type |
|---|---|---|
| 1 | 0.0~0.6 | 无旱 No drought |
| 2 | 0.6~0.7 | 轻旱 Light drought |
| 3 | 0.7~0.8 | 中旱 Mid-drought |
| 4 | 0.8~0.9 | 重旱 Heavy drought |
| 5 | 0.9~1.0 | 特旱 Extraordinary drought |
表1 干旱等级划分
Table 1 Drought classification
| 等级 Grade | 作物缺水指数 CWSI | 类型 Type |
|---|---|---|
| 1 | 0.0~0.6 | 无旱 No drought |
| 2 | 0.6~0.7 | 轻旱 Light drought |
| 3 | 0.7~0.8 | 中旱 Mid-drought |
| 4 | 0.8~0.9 | 重旱 Heavy drought |
| 5 | 0.9~1.0 | 特旱 Extraordinary drought |
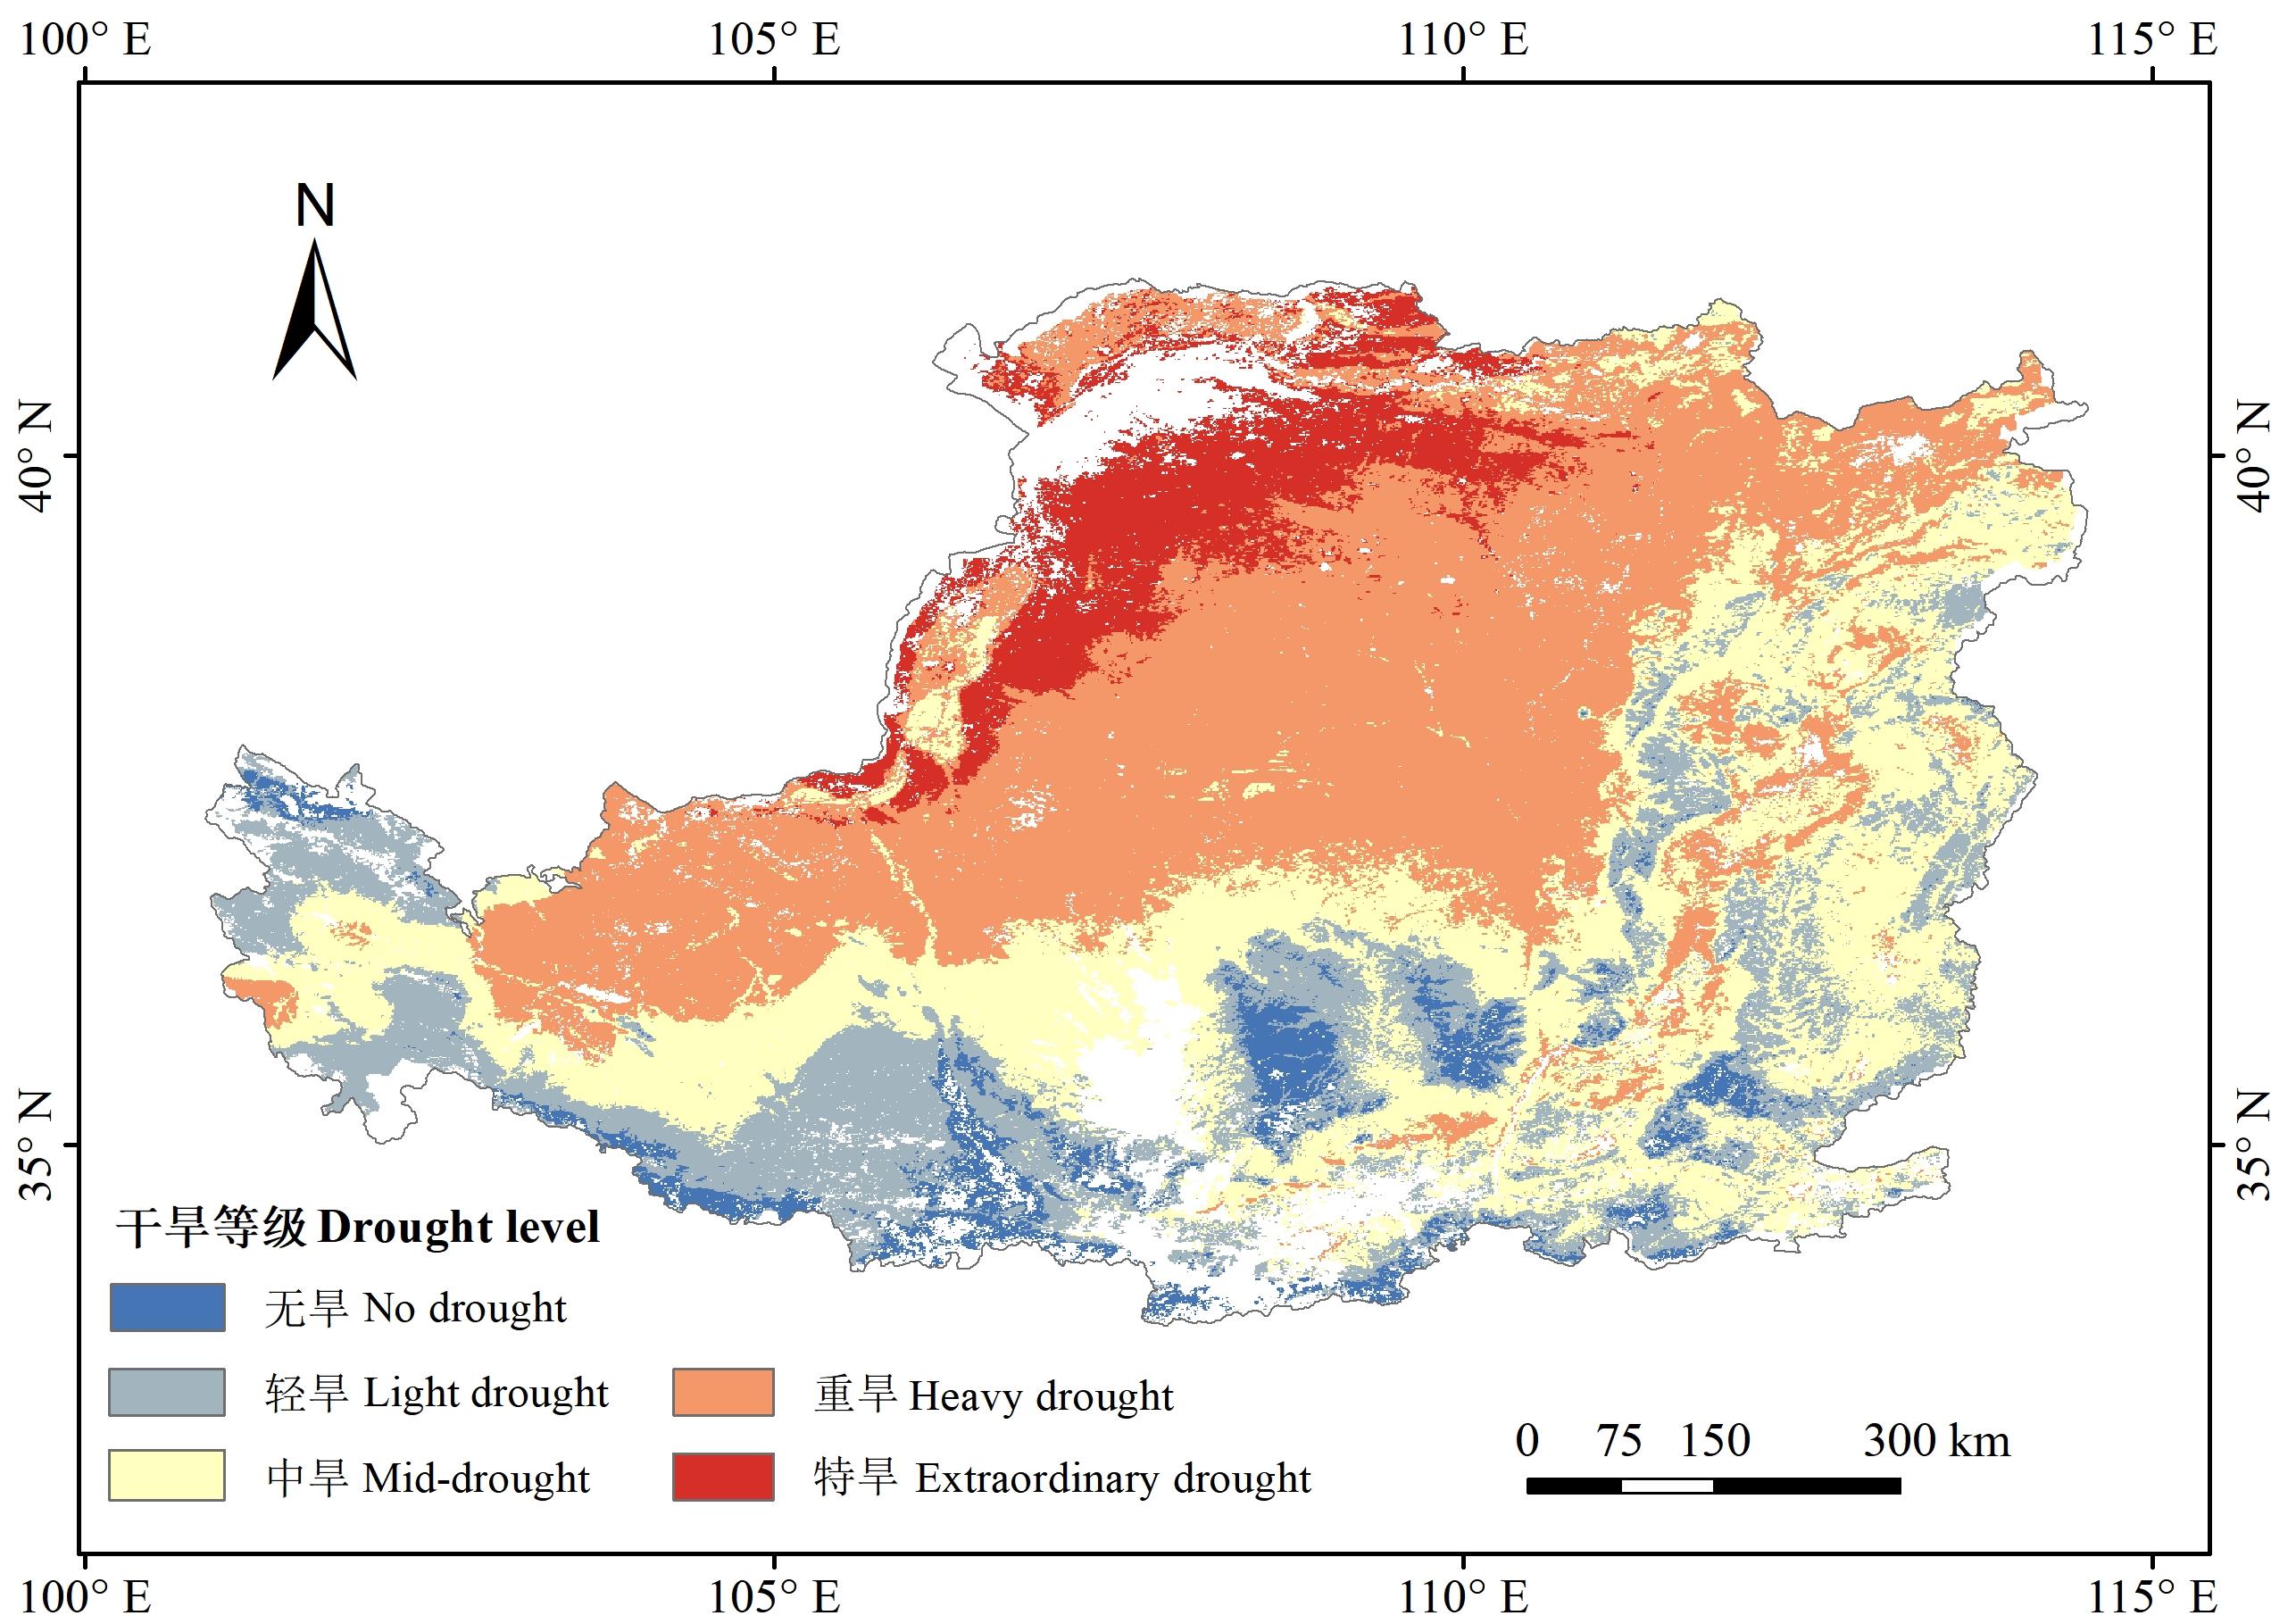
图2 黄土高原干旱等级分布该图基于自然资源部标准地图服务网站GS(2019)1822号标准地图制作,底图边界无修改。Produced based on the Department of Natural Resources standard map service website, standard map No. GS (2019) 1822, with no modifications to the base map boundaries.
Fig. 2 Distribution of drought levels on the Loess Plateau
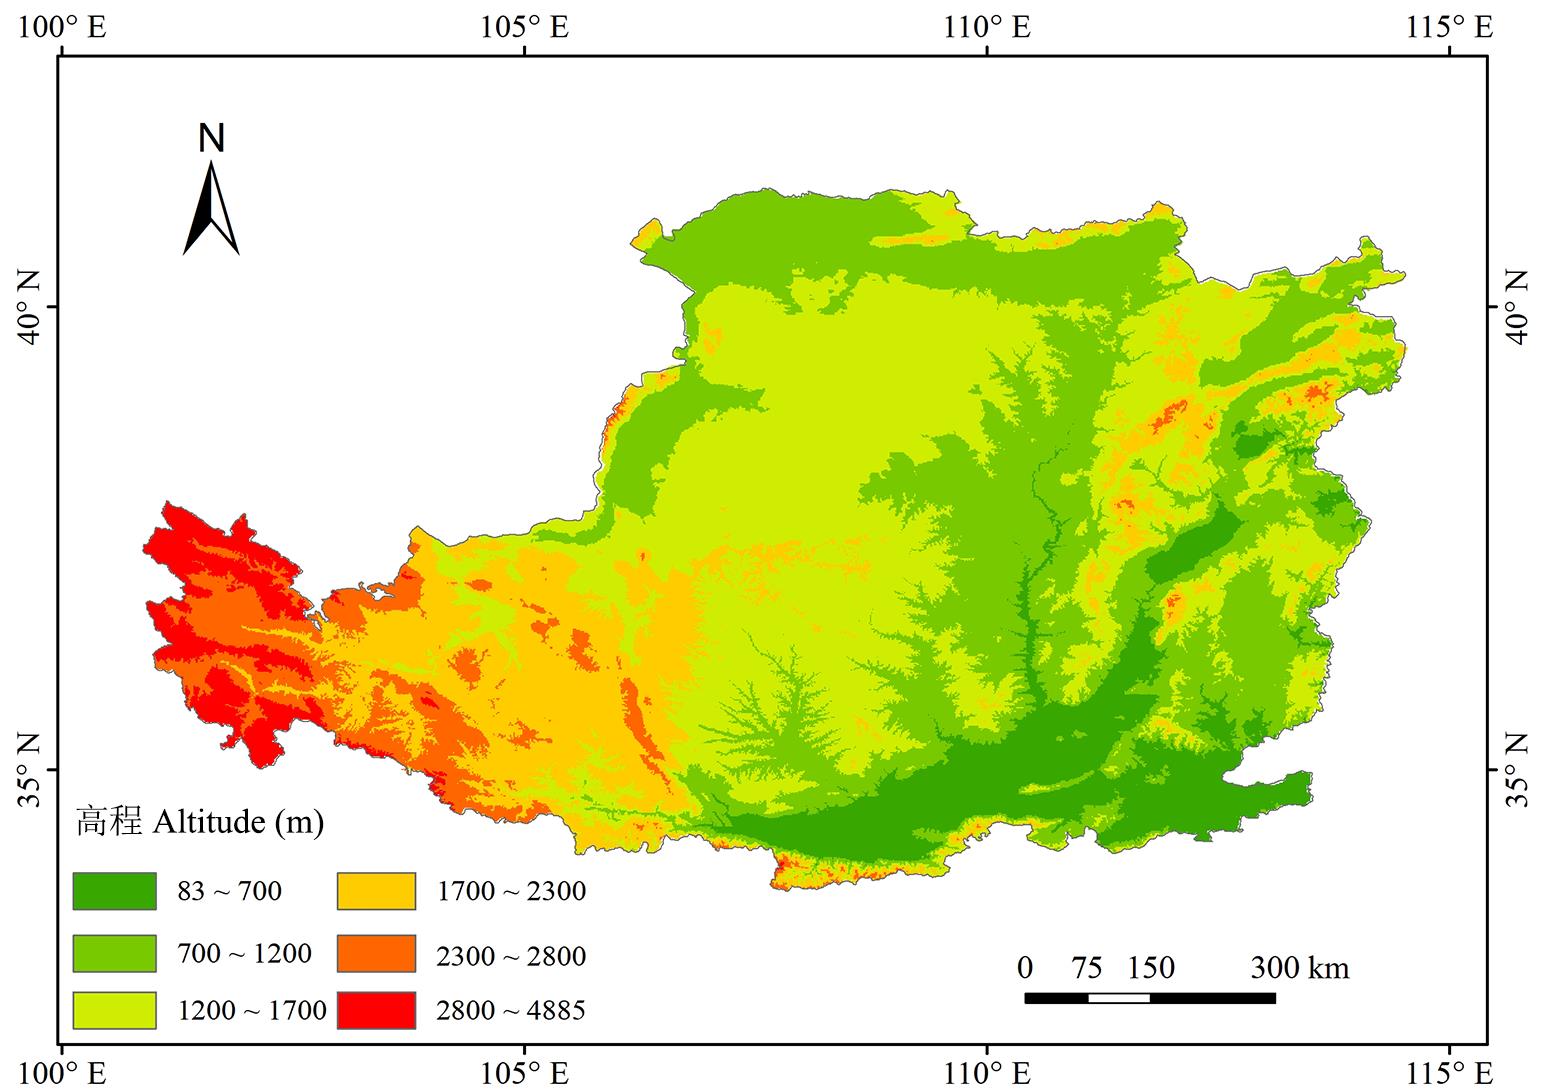
图3 黄土高原高程分级示意图该图基于自然资源部标准地图服务网站GS(2019)1822号标准地图制作,底图边界无修改。Produced based on the Department of Natural Resources standard map service website, standard map No. GS (2019) 1822, with no modifications to the base map boundaries.
Fig. 3 Schematic diagram of the elevation classification of the Loess Plateau
| 高程Altitude (m) | 范围Range | 平均值Average |
|---|---|---|
| 83~700 | 0.48~0.89 | 0.74 |
| 700~1200 | 0.40~0.96 | 0.79 |
| 1200~1700 | 0.39~0.95 | 0.81 |
| 1700~2300 | 0.43~0.95 | 0.75 |
| 2300~2800 | 0.45~0.94 | 0.71 |
| 2800~4885 | 0.50~0.85 | 0.67 |
表2 CSWI在不同高程区间内的分布
Table 2 Distribution of CSWI in different elevation intervals
| 高程Altitude (m) | 范围Range | 平均值Average |
|---|---|---|
| 83~700 | 0.48~0.89 | 0.74 |
| 700~1200 | 0.40~0.96 | 0.79 |
| 1200~1700 | 0.39~0.95 | 0.81 |
| 1700~2300 | 0.43~0.95 | 0.75 |
| 2300~2800 | 0.45~0.94 | 0.71 |
| 2800~4885 | 0.50~0.85 | 0.67 |
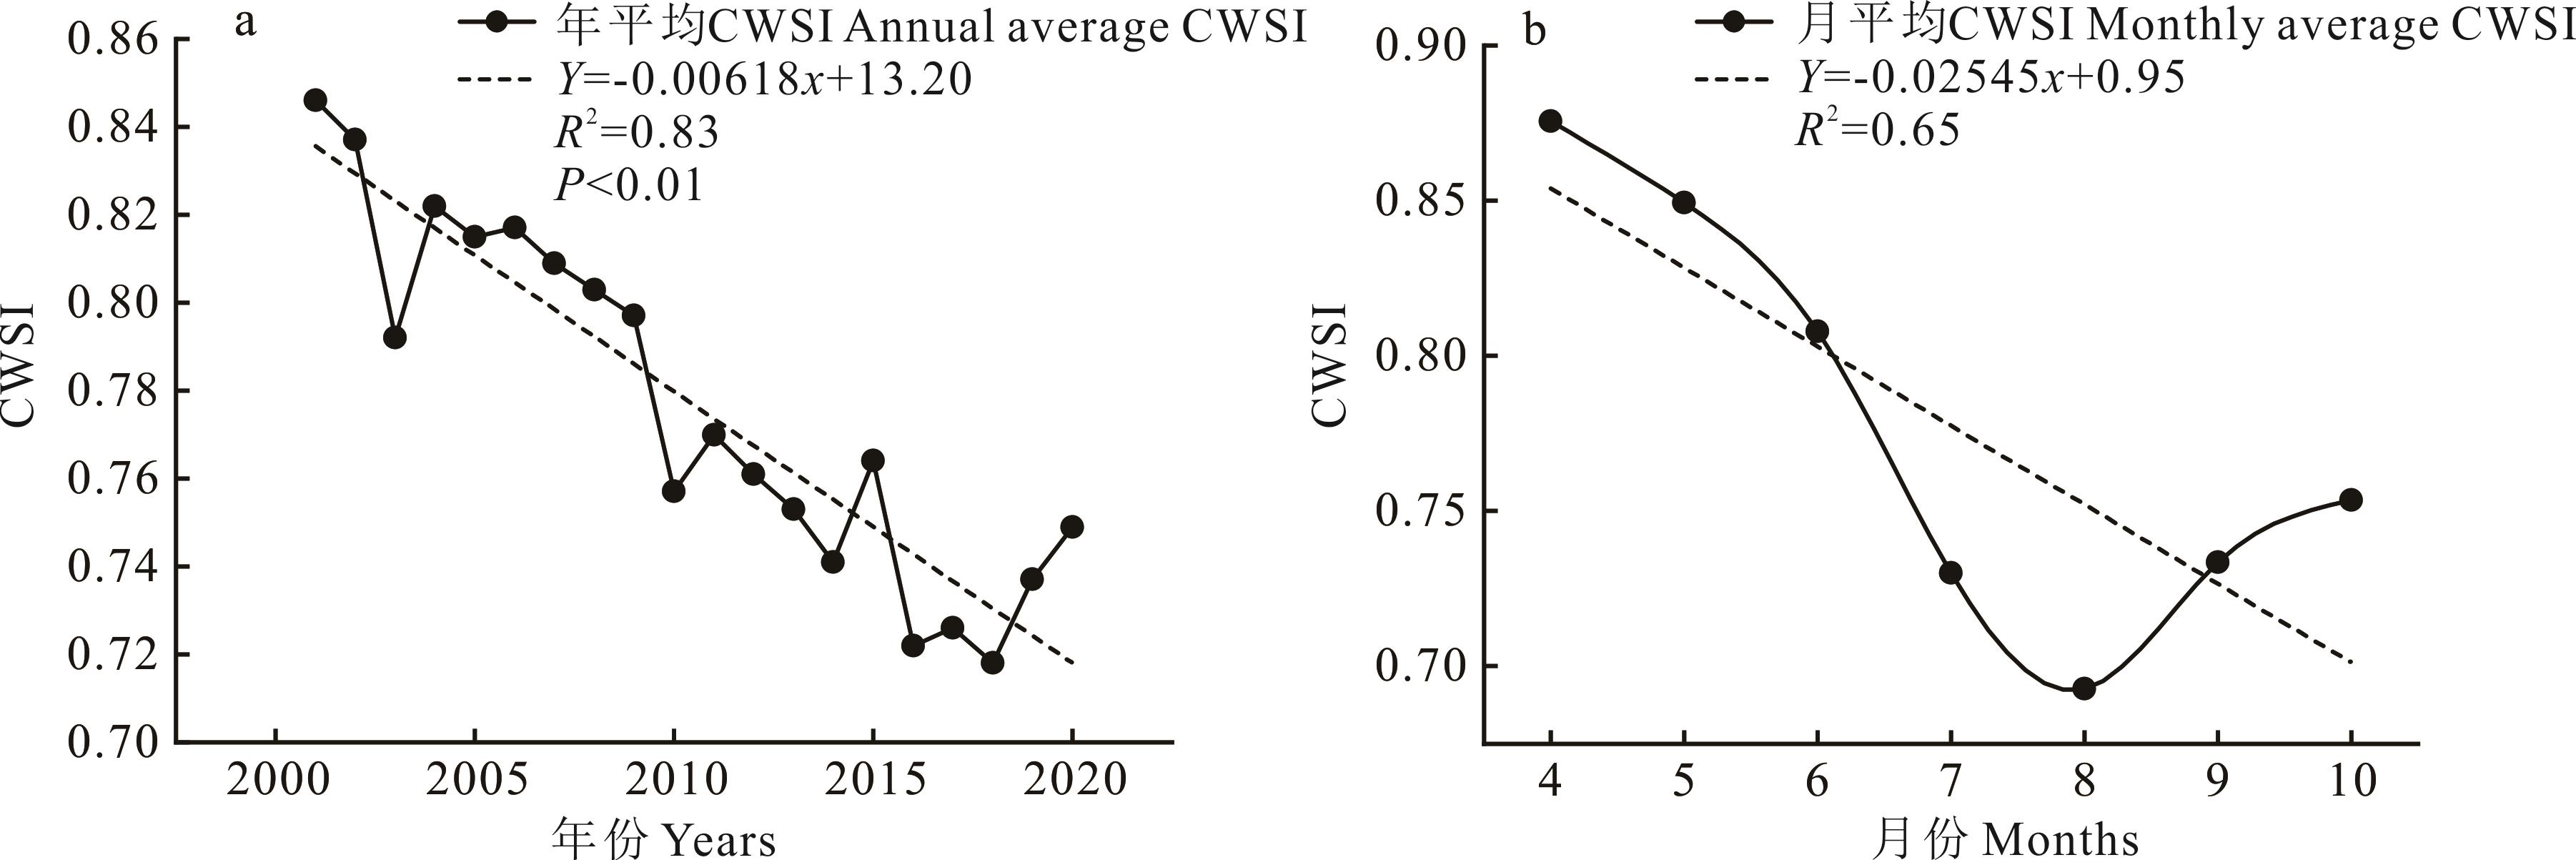
图4 黄土高原2001-2020年CWSI年均变化(a)和黄土高原4-10月CWSI月均变化(b)
Fig. 4 Annual mean changes of CWSI in 2001-2020 (a) and monthly mean changes of CWSI in April-October (b) on the Loess Plateau
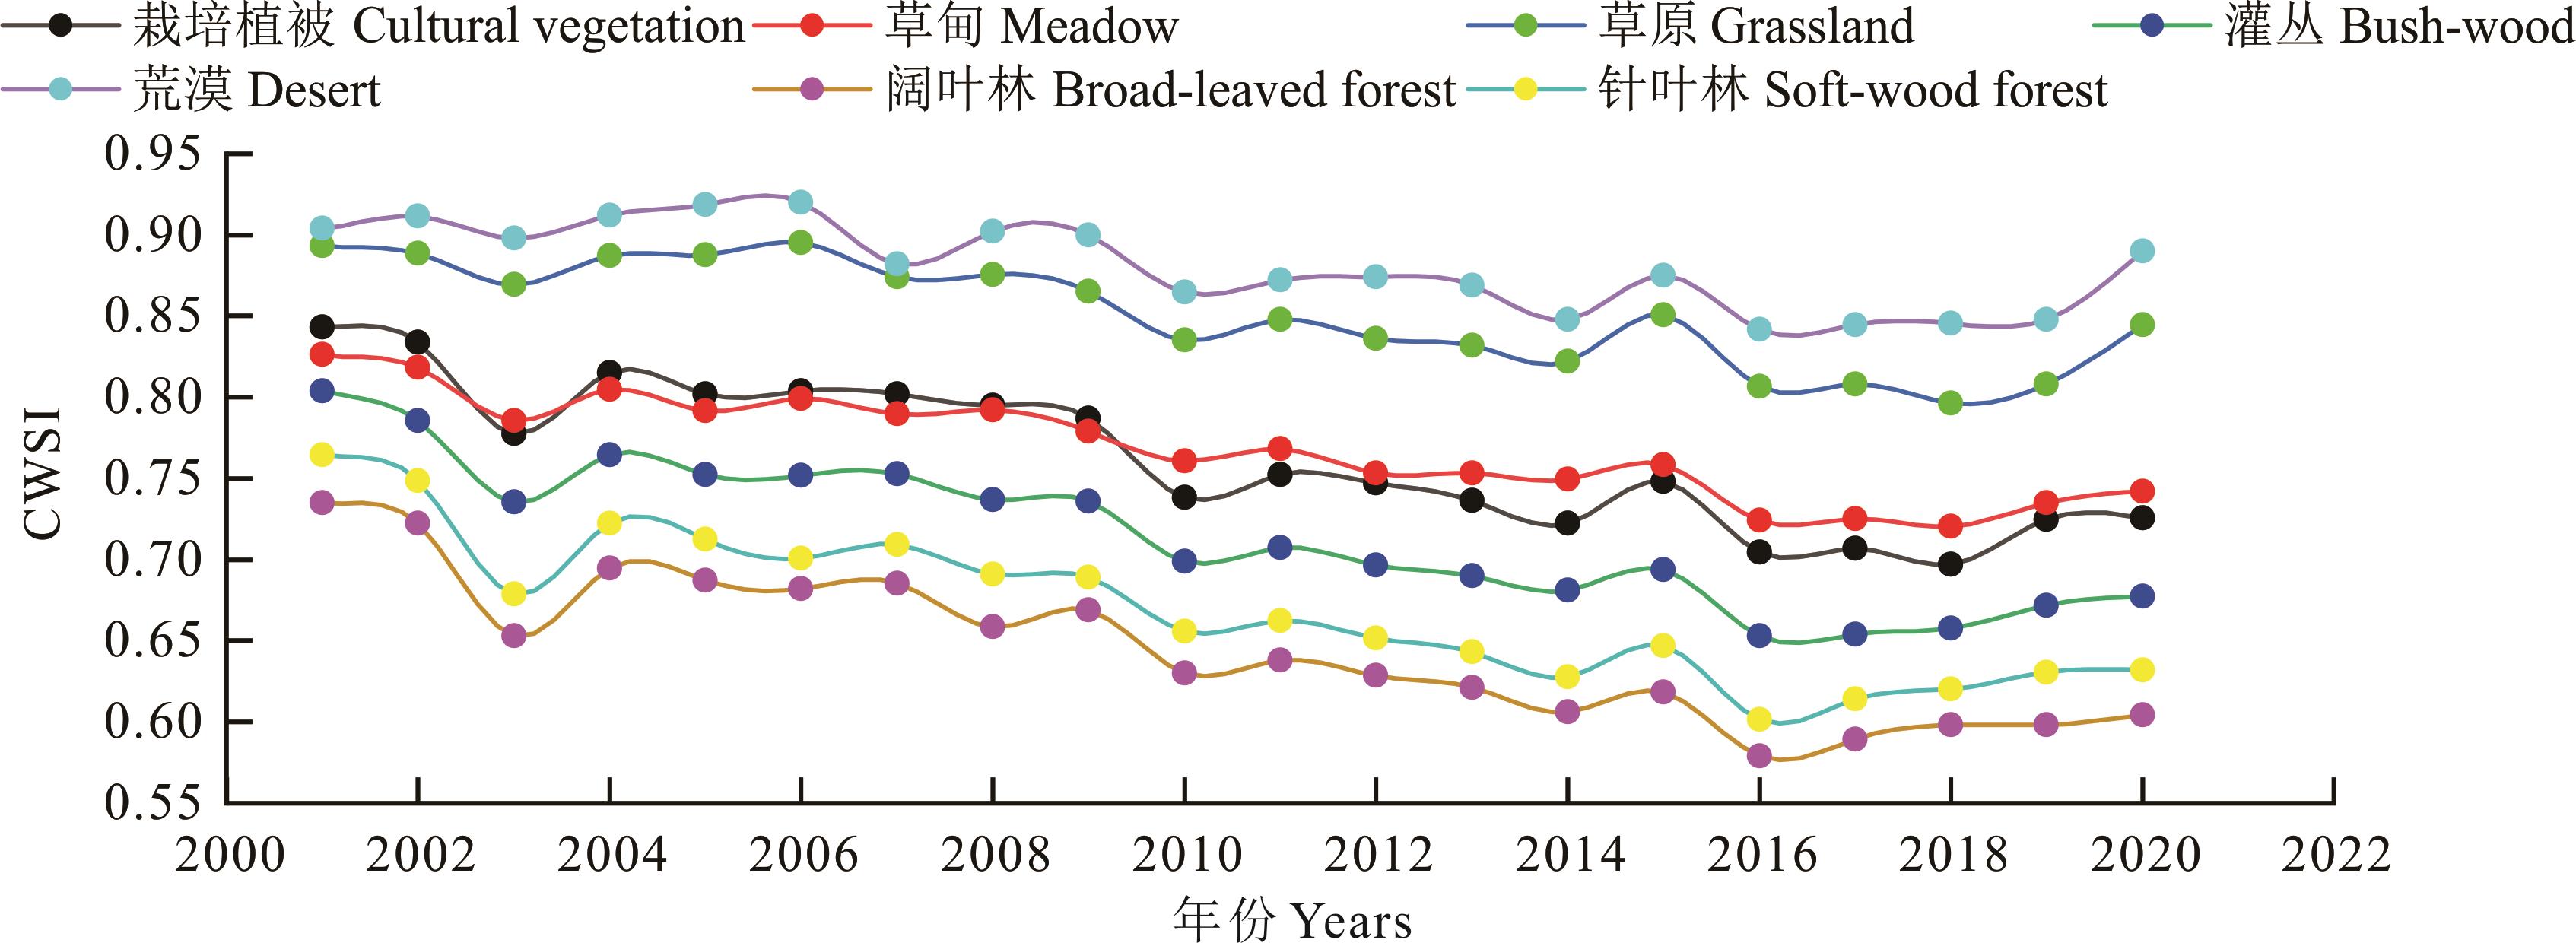
图5 不同植被类型2001-2020年CWSI年均变化
Fig. 5 Average annual change of CWSI in 2001-2020 for different vegetation types
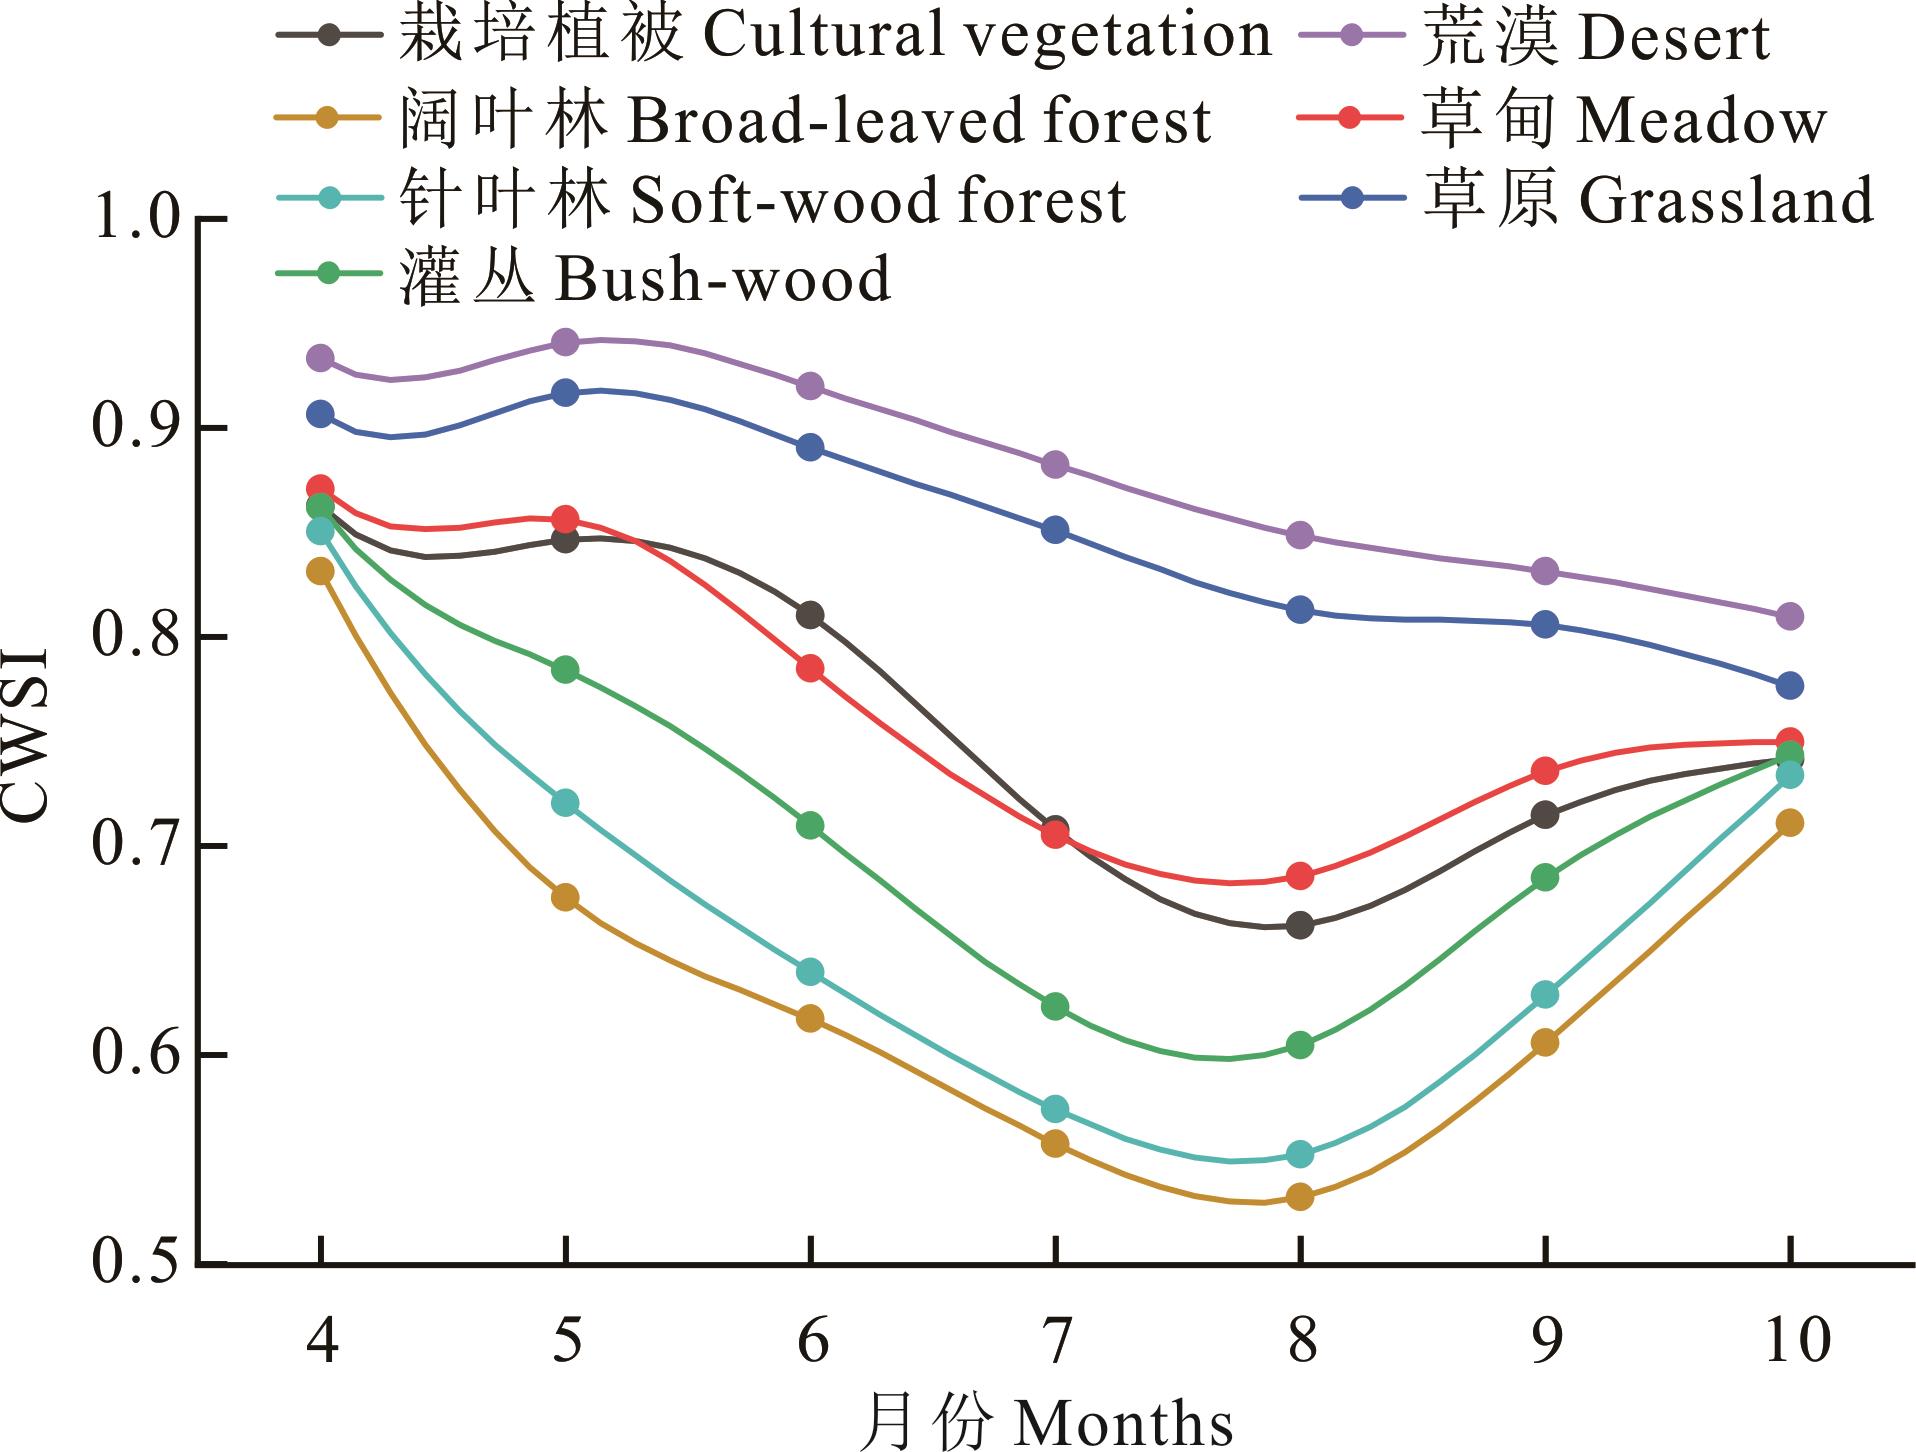
图6 不同植被类型4-10月CWSI月均变化
Fig. 6 Monthly average changes in CWSI from April to October for different vegetation types

图7 4月CWSI与4 (a)、5 (b)和6 (c)月NDVI的偏相关系数该图基于自然资源部标准地图服务网站GS(2019)1822号标准地图制作,底图边界无修改。Produced based on the Department of Natural Resources standard map service website, standard map No. GS (2019)1822, with no modifications to the base map boundaries.
Fig. 7 Bias correlation coefficients between CWSI in April and NDVI in April (a), May (b) and June (c)
植被类型 Vegetation type | 偏相关系数平均值 Mean partial correlation coefficient | ||
|---|---|---|---|
| 4月 April | 5月 May | 6月 June | |
| 栽培植被 Cultural vegetation | -0.098 | -0.110 | -0.056 |
| 草甸 Meadow | -0.106 | -0.125 | -0.088 |
| 草原 Grassland | -0.155 | -0.173 | -0.104 |
| 灌丛 Bush-wood | -0.145 | -0.153 | -0.093 |
| 荒漠 Desert | -0.069 | -0.035 | 0.116 |
| 阔叶林Broad-leaved forest | -0.139 | -0.126 | -0.034 |
| 针叶林Soft-wood forest | -0.121 | -0.121 | -0.046 |
表3 4-6月不同植被类型的CWSI和NDVI偏相关系数平均值
Table 3 Mean partial correlation coefficients of CWSI and NDVI of different vegetation types in April, May and June
植被类型 Vegetation type | 偏相关系数平均值 Mean partial correlation coefficient | ||
|---|---|---|---|
| 4月 April | 5月 May | 6月 June | |
| 栽培植被 Cultural vegetation | -0.098 | -0.110 | -0.056 |
| 草甸 Meadow | -0.106 | -0.125 | -0.088 |
| 草原 Grassland | -0.155 | -0.173 | -0.104 |
| 灌丛 Bush-wood | -0.145 | -0.153 | -0.093 |
| 荒漠 Desert | -0.069 | -0.035 | 0.116 |
| 阔叶林Broad-leaved forest | -0.139 | -0.126 | -0.034 |
| 针叶林Soft-wood forest | -0.121 | -0.121 | -0.046 |
| 1 | Tian F, Wu J J, Liu L Z, et al. Spationtemporal transferring characteristics of dought and its hotpots detection in North China Plain during 1901-2015. Journal of Arid Land Pesource and Environment, 2020, 34(6): 87-96. |
| 田丰, 武建军, 刘雷震, 等. 1901-2015年华北平原干旱时空转移特征及热点区域探测. 干旱区资源与环境, 2020, 34(6): 87-96. | |
| 2 | Zhang L X, Zhou T J. Drought over east Asia: A review. Journal of Climate, 2015, 28(8): 3375-3379. |
| 3 | Wang J S, Li Y H, Wang R Y, et al. Preliminary analysis on the demand and review of progress in the field of meterological drought research. Journal of Arid Meteorology, 2012, 30(4): 497-508. |
| 王劲松, 李耀辉, 王润元, 等. 我国气象干旱研究进展评述. 干旱气象, 2012, 30(4): 497-508. | |
| 4 | Liu Z, Wang Y, Shao M, et al. Spatiotemporal analysis of multiscalar drought characteristics across the Loess Plateau of China. Journal of Hydrology, 2016, 534: 281-299. |
| 5 | Zargar A, Sadiq R, Naser B, et al. A review of drought indices. Dossiers Environment, 2011, 19(1): 333-349. |
| 6 | Jackson R, Kustas W, Choudhury B. A reexamination of the crop water stress index. Irrigation Science, 1988, 9(4): 309-317. |
| 7 | Mu Q, Zhao M, Running S W. Improvements to a MODIS global terrestrial evapotranspiration algorithm. Remote Sensing of Environment, 2011, 115(8): 1781-1800. |
| 8 | Zhang T, Peng J, Liang W, et al. Spatial-temporal patterns of water use efficiency and climate controls in China’s Loess Plateau during 2000-2010. Science of the Total Environment, 2016, 565: 105-122. |
| 9 | Wang Z, Wang F, Zhang Y. Spatio-temporal distribution characteristics and influencing factors of drought in Anhui Province based on CWSI. Journal of Natural Resources, 2018, 33(5): 853-866. |
| 汪左, 王芳, 张运. 基于CWSI的安徽省干旱时空特征及影响因素分析. 自然资源学报, 2018, 33(5): 853-866. | |
| 10 | Liang R G, Zhou X, Li S, et al. Analysis of temporal and spatial variation characteristics of drought in Guizhou Province and its influencing factors based on CWSI. Research of Soil and Water Conservation, 2022, 29(3): 284-291. |
| 梁任刚, 周旭, 李松, 等. 基于CWSI的贵州省干旱时空变化特征及影响因素分析. 水土保持研究, 2022, 29(3): 284-291. | |
| 11 | Su W Z, Yang Y C, Wang T, et al. Variation characteristics and influencing factors of drought in the Loess Plateau in recent 20 years. Science Technology and Engineering, 2023, 23(11): 4551-4560. |
| 苏文壮, 杨永崇, 王涛, 等. 近20年黄土高原干旱变化特征及其影响因素. 科学技术与工程, 2023, 23(11): 4551-4560. | |
| 12 | Ma Z C, Sun P, Yao R, et al. Temporal and spatial variation of drought and its impact on vegetation in Inner Mongolia. Journal of Soil and Water Conservation, 2022, 36(6): 231-240. |
| 马梓策, 孙鹏, 姚蕊, 等. 内蒙古地区干旱时空变化特征及其对植被的影响. 水土保持学报, 2022, 36(6): 231-240. | |
| 13 | Hou Q Q, Pei T T, Chen Y, et al. Variation of drought and its trend in the Loess Plateau from 1986 to 2019. Chinese Journal of Applied Ecology, 2021, 32(2): 649-660. |
| 侯青青, 裴婷婷, 陈英, 等. 1986-2019年黄土高原干旱变化特征及趋势. 应用生态学报, 2021, 32(2): 649-660. | |
| 14 | Wang Y, Shi H J, Jiang Y M, et al. Spatio-temporal variation of drought characteristics and its influencing factors in the Loess Plateau based on TVDI. Transactions of the Chinese Society for Agricultural Machinery, 2023, 54(7): 184-195. |
| 王椰, 史海静, 姜艳敏, 等. 基于TVDI的黄土高原干旱时空变化与其影响因素. 农业机械学报, 2023, 54(7): 184-195. | |
| 15 | Fan L L, Geng B, Wang J L, et al. Temporal and spatial dynamics of drought and its response to climate change in the Loess Plateau from 2001 to 2020. Research of Soil and Water Conservation, 2022, 29(6): 183-191. |
| 樊莉莉, 耿斌, 王吉林, 等. 2001-2020年黄土高原干旱时空动态及其对气候变化的响应. 水土保持研究, 2022, 29(6): 183-191. | |
| 16 | Gong J F, Wang Y R. Response of climate in Loess Plateau in China to global change. Agricultural Research in the Arid Areas, 2005(6): 10-15. |
| 龚建福, 王毅荣. 黄土高原气候响应全球变化的敏感区. 干旱地区农业研究, 2005(6): 10-15. | |
| 17 | Zhang J X, Zhang D Y, Liu W F, et al. ESAI based assessment of desertification risk in Loess Plateau. Bulletin of Soil and Water Conservation, 2017, 37(2): 339-344, 353. |
| 张建香, 张多勇, 刘万锋, 等. 基于ESAI的黄土高原荒漠化风险评估. 水土保持通报, 2017, 37(2): 339-344, 353. | |
| 18 | Ji Z X, Pei T T, Chen Y, et al. Vegetation phenology change and its response to seasonal climate changes on the Loess Plateau. Acta Ecologica Sinica, 2021, 41(16): 6600-6612. |
| 吉珍霞, 裴婷婷, 陈英, 等. 黄土高原植被物候变化及其对季节性气候变化的响应. 生态学报, 2021, 41(16): 6600-6612. | |
| 19 | Xie B N, Qin Z F, Wang Y, et al. Monitoring vegetation phenology and their response to climate change on Chinese Loess Plateau based on the remote sensing. Transactions of the Chinese Society of Agricultural Engineering, 2015, 31(15): 153-160. |
| 谢宝妮, 秦占飞, 王洋, 等. 基于遥感的黄土高原植被物候监测及其对气候变化的响应. 农业工程学报, 2015, 31(15): 153-160. | |
| 20 | Li Y X, Zhu Q K, Shi R Y, et al. Spatial and temporal changes of vegetation cover and its influencing factors in the Loess Plateau from 2000 to 2018. Science of Soil and Water Conservation, 2021, 19(4): 60-68. |
| 李依璇, 朱清科, 石若莹, 等. 2000-2018年黄土高原植被覆盖时空变化及影响因素. 中国水土保持科学, 2021, 19(4): 60-68. | |
| 21 | Editorial Committee of China Vegetation Map, Chinese Academy of Sciences. China 1∶1 million vegetation dataset. National Glacial Tundra Desert Science Data Centre (http://www.ncdc.ac.cn), 2020. |
| 中国科学院中国植被图编辑委员会. 中国1∶100万植被数据集. 国家冰川冻土沙漠科学数据中心(http://www.ncdc.ac.cn), 2020. | |
| 22 | Bai J J, Yuan Y, Di L. Comparison between TVDI and CWSI for drought monitoring in the Guanzhong Plain, China. Journal of Integrative Agriculture, 2017, 16(2): 389-397. |
| 23 | Ma Z C, Sun P, Zhang Q, et al. Characterization and evaluation of MODIS-derived crop water stress index (CWSI) for monitoring drought from 2001 to 2017 over Inner Mongolia. Sustainability, 2021, 13(2): 916. |
| 24 | Wu T X, Li B F, Guo H, et al. Analysis of drought variation characteristics in North China Plain on optimized remote sensing drought index. Acta Ecologica Sinica, 2023, 43(4): 1621-1634. |
| 吴天晓, 李宝富, 郭浩, 等. 基于优选遥感干旱指数的华北平原干旱时空变化特征分析. 生态学报, 2023, 43(4): 1621-1634. | |
| 25 | Guo H, Yuan J G, Wang J Z, et al. Spatiao-temporal evolution of net primary productivity in Beijing-Tianjin-Hebei region based on MOD17A3 data. Journal of Changjiang River Scientific Research Institute, 2023, 40(7): 66-72,103. |
| 郭豪, 袁金国, 王景芝, 等. 基于MOD17A3的京津冀地区植被净初级生产力时空演变. 长江科学院院报, 2023, 40(7):66-72,103. | |
| 26 | Jing J L, Deng Q F, He C X, et al. Spatio-temporal evolution of NDVI and its climate driving factors in the Southwest karst area from 1999 to 2019. Research of Soil and Water Conservation, 2023, 30(3): 232-239. |
| 靖娟利, 邓棋方, 和彩霞, 等. 1999-2019年西南喀斯特地区NDVI时空变化及其气候驱动. 水土保持研究, 2023, 30(3): 232-239. | |
| 27 | Li M, Deng Y Y, Ge C H, et al. Characteristics of meteorological drought across the Loess Plateau and their linkages with large-scale climatic factors during 1961-2017. Ecology and Environmental Sciences, 2020, 29(11): 2231-2239. |
| 李明, 邓宇莹, 葛晨昊, 等. 1961-2017年黄土高原气象干旱特征及其与大尺度气候因子的联系. 生态环境学报, 2020, 29(11): 2231-2239. | |
| 28 | Wang Y S, Li X Y, Shi F Z, et al. The grain for green project intensifies evapotranspiration in the revegetation area of the Loess Plateau in China. Chinese Science Bulletin, 2019, 64(Z1): 588-599. |
| 王雅舒, 李小雁, 石芳忠, 等. 退耕还林还草工程加剧黄土高原退耕区蒸散发. 科学通报, 2019, 64(Z1): 588-599. | |
| 29 | Wang K L, Wang Z H, Xiao P Q, et al. Assessment on the impact of climate and changes of underlying surface on evapotranspiration in the Loess Plateau. Journal of Soil and Water Conservation, 2022, 36(3): 166-172, 180. |
| 王凯利, 王志慧, 肖培青, 等. 气候与下垫面变化对黄土高原蒸散发变化的影响评估. 水土保持学报, 2022, 36(3): 166-172, 180. | |
| 30 | Zhang S Z, Zhu X F, Liu T T, et al. Response of gross primary production to drought under climate change in different vegetation regions of China. Acta Ecologica Sinica, 2022, 42(8): 3429-3440. |
| 张世喆, 朱秀芳, 刘婷婷, 等. 气候变化下中国不同植被区总初级生产力对干旱的响应. 生态学报, 2022, 42(8): 3429-3440. | |
| 31 | Yao J X, Xiao C Z, Zhang Z, et al. Vegetation feature types extraction in arid regions based on GEE multi-source remote sensing data. Arid Zone Research, 2024, 41(1): 157-168. |
| 姚金玺, 肖成志, 张志, 等. 基于GEE多源遥感数据的干旱区植被地物类型提取. 干旱区研究, 2024, 41(1): 157-168. | |
| 32 | Mcdowell N G. Mechanisms linking drought, hydraulics, carbon metabolism, and vegetation mortality. Plant Physiology, 2011, 155(3): 1051-1059. |
| [1] | 王宝, 谢占玲, 郭璟, 唐永鹏, 孟清, 彭清青, 杨家宝, 董德誉, 徐鸿雁, 高太侦, 张凡, 段迎珠. 真菌发酵液浸种燕麦对其抗旱性及根际真菌群落结构的影响[J]. 草业学报, 2024, 33(9): 126-139. |
| [2] | 张婷婷, 刘宇乐, 陈红, 许凌欣, 陈祥伟, 王恩姮, 严俊鑫. 不同外源物质对盐、碱及干旱胁迫下草木樨种子萌发、幼苗生长及生理的影响[J]. 草业学报, 2024, 33(8): 122-132. |
| [3] | 魏娜, 敬文茂, 许尔文, 王荣新, 赵晶忠, 马雪娥, 张吉宇, 刘文献. 白花草木樨MaERF058基因耐旱功能验证[J]. 草业学报, 2024, 33(8): 159-169. |
| [4] | 曾露婧, 王国华. 干旱及复水对荒漠绿洲过渡带一年生草本植物生长及生理特性的影响[J]. 草业学报, 2024, 33(5): 41-57. |
| [5] | 李硕, 李培英, 孙宗玖, 李雯. 基于转录组测序的狗牙根抗旱根系关键代谢途径分析[J]. 草业学报, 2024, 33(4): 186-198. |
| [6] | 李妍, 马富龙, 韩路, 王海珍. 美国‘WL’系列不同秋眠级苜蓿品种在南疆的生产性能与适应性评价[J]. 草业学报, 2024, 33(3): 139-149. |
| [7] | 刘芳, 王佩佩, 曹玉莹, 刘俊娥, 周正朝. 黄土高原典型草本植物根系分布特征及其对土壤理化性质的影响研究[J]. 草业学报, 2024, 33(10): 1-13. |
| [8] | 谭炯锐, 查同刚, 张泽宇, 张晓霞, 滕红梅, 王玲丽, 赵莉丽, 王奥, 王馨珧. 猪毛菜响应干旱胁迫的叶片结构、生理及转录组分析[J]. 草业学报, 2024, 33(1): 75-88. |
| [9] | 姜瑛, 张辉红, 魏畅, 徐正阳, 赵颖, 刘芳, 李鸽子, 张雪海, 柳海涛. 外源褪黑素对干旱胁迫下玉米幼苗根系发育及生理生化特性的影响[J]. 草业学报, 2023, 32(9): 143-159. |
| [10] | 王宝强, 马文静, 王贤, 朱晓林, 赵颖, 魏小红. 一氧化氮对干旱胁迫下紫花苜蓿幼苗次生代谢产物的影响[J]. 草业学报, 2023, 32(8): 141-151. |
| [11] | 张一龙, 李雯, 喻启坤, 李培英, 孙宗玖. 狗牙根叶与根氮代谢对不同干旱胁迫的响应机制[J]. 草业学报, 2023, 32(7): 175-187. |
| [12] | 张浩, 胡海英, 李惠霞, 贺海明, 马霜, 马风华, 宋柯辰. 荒漠草原优势植物牛枝子对干旱胁迫的生理响应与转录组分析[J]. 草业学报, 2023, 32(7): 188-205. |
| [13] | 梁佳, 胡朝阳, 谢志明, 马刘峰, 陈芸, 方志刚. 外源褪黑素缓解甜高粱幼苗干旱胁迫的生理效应[J]. 草业学报, 2023, 32(7): 206-215. |
| [14] | 马婧, 郭方君, 邹枝慧, 孙琳, 陈芳. 腾格里沙漠南缘不同恢复阶段沙质草地植被的季节变化特征[J]. 草业学报, 2023, 32(5): 203-210. |
| [15] | 曹玉莹, 苏雪萌, 周正朝, 郑群威, 岳佳辉. 黄土高原典型草本植物根-土复合体抗剪性能的空间差异性及其影响因素研究[J]. 草业学报, 2023, 32(5): 94-105. |
| 阅读次数 | ||||||
|
全文 |
|
|||||
|
摘要 |
|
|||||