
ISSN 1004-5759 CN 62-1105/S
Acta Prataculturae Sinica ›› 2026, Vol. 35 ›› Issue (5): 1-19.DOI: 10.11686/cyxb2025327
Yi-bo WANG1( ), Xin-ning HAN2(), Ke AN3, Meng-jie ZHANG4, Hui-hui TIAN1, Hang-hang TUO5, Xiao-shan ZHANG5, Fa-ming YE6,7, Zi-ming YIN5, Xiao-rui MA5, Qing YANG6,7, Tao SHI5, Wei LI5()
Received:2025-08-14
Revised:2025-09-15
Online:2026-05-20
Published:2026-03-11
Contact:
Xin-ning HAN,Wei LI
Yi-bo WANG, Xin-ning HAN, Ke AN, Meng-jie ZHANG, Hui-hui TIAN, Hang-hang TUO, Xiao-shan ZHANG, Fa-ming YE, Zi-ming YIN, Xiao-rui MA, Qing YANG, Tao SHI, Wei LI. Google Earth Engine-based dynamic monitoring of ecological status in the Weihe River Basin and mechanisms driving it[J]. Acta Prataculturae Sinica, 2026, 35(5): 1-19.
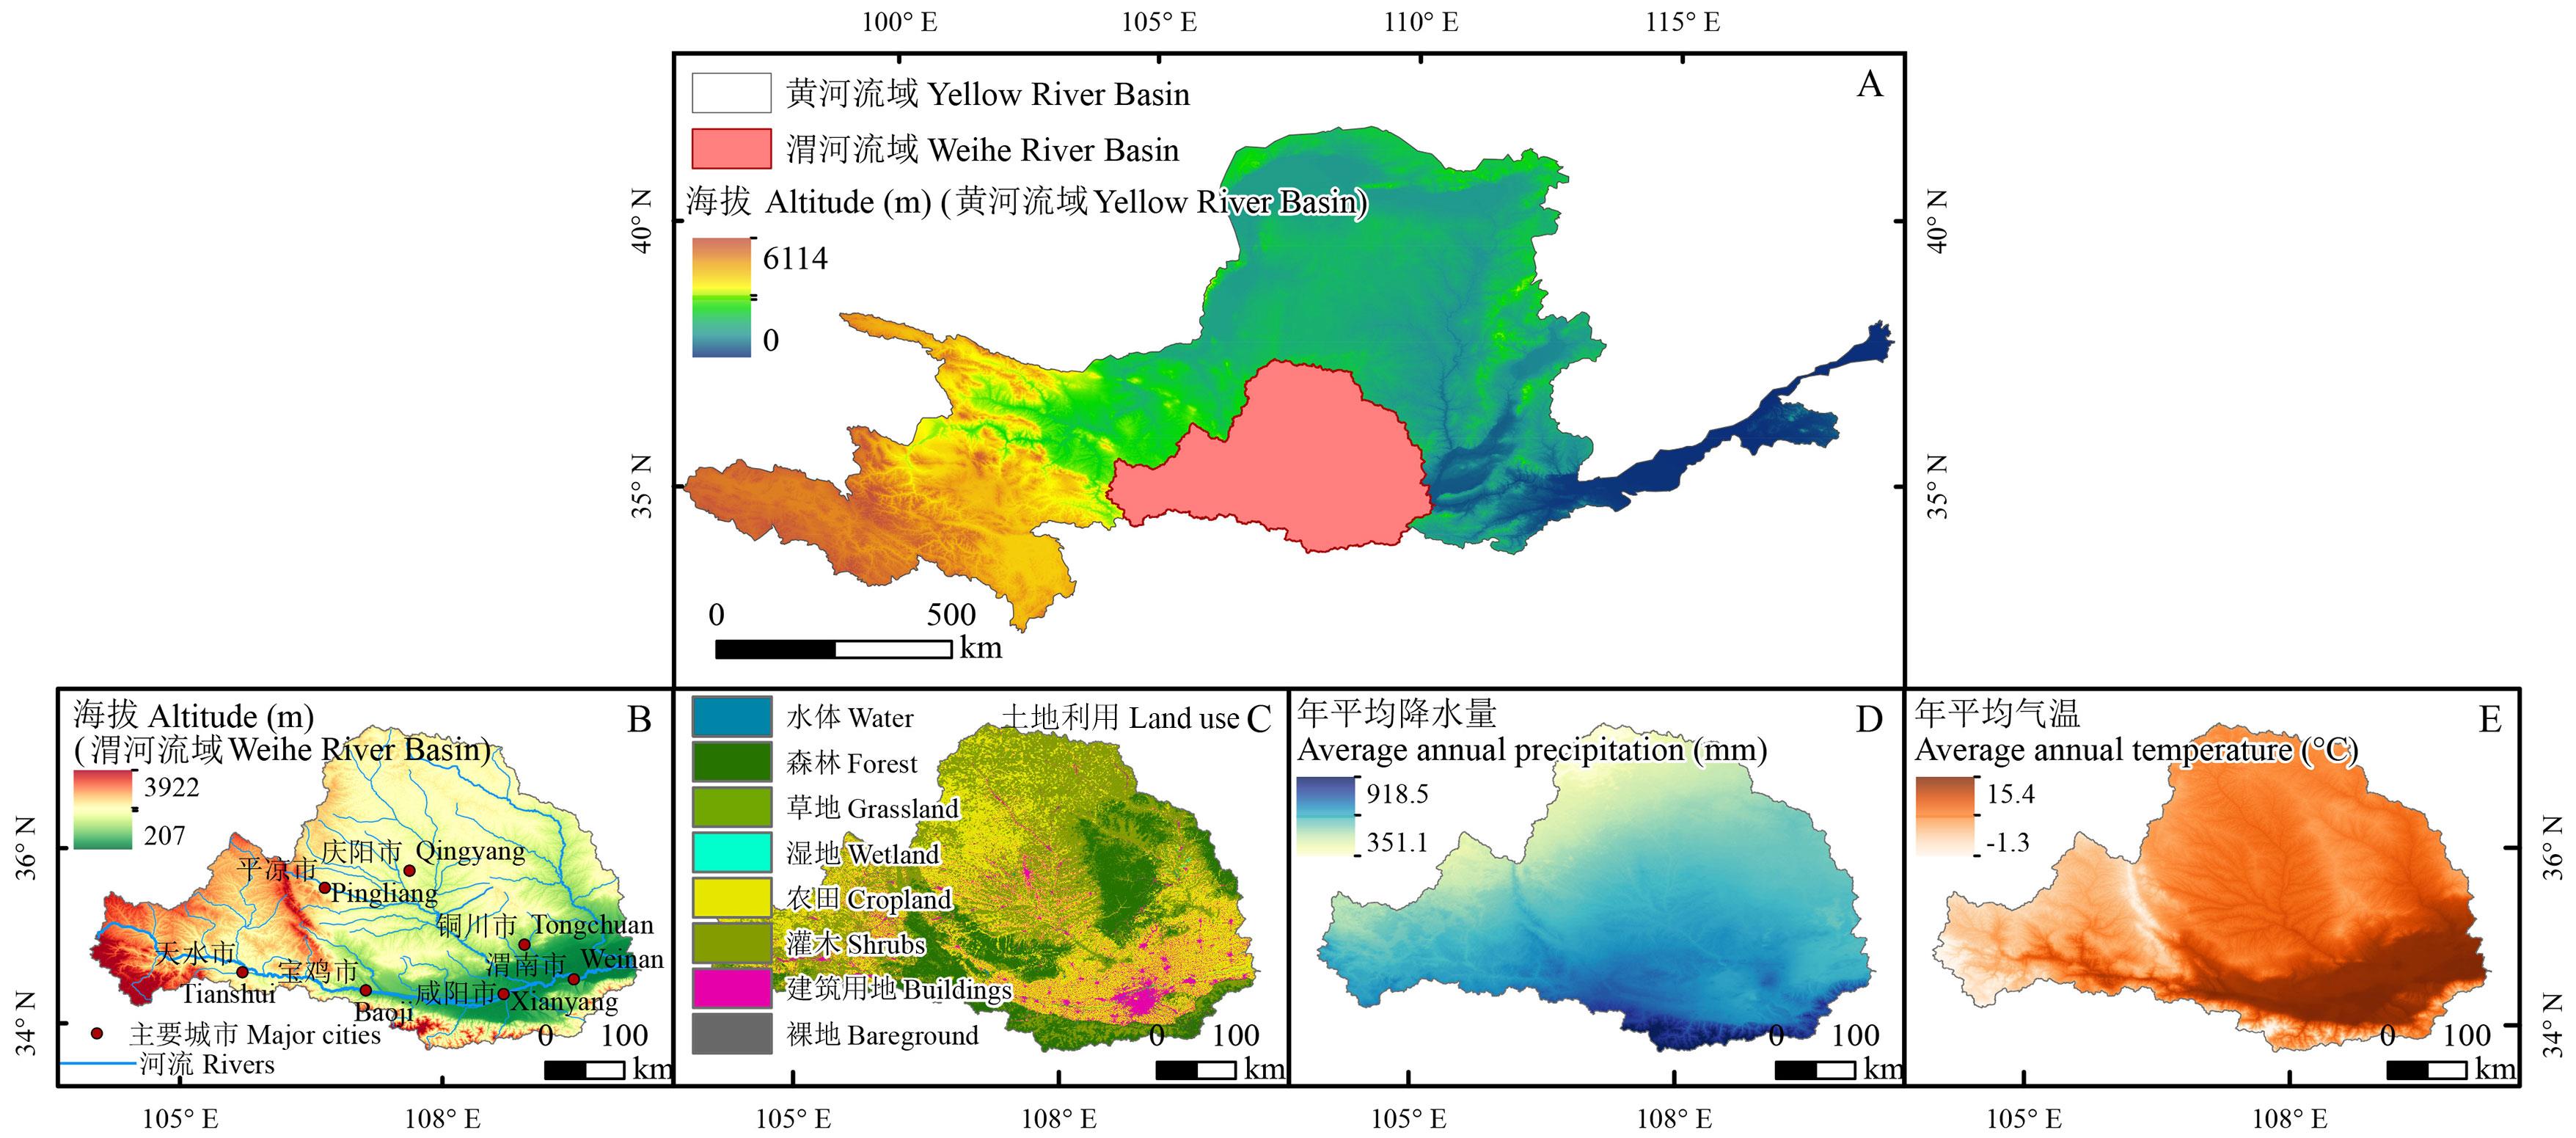
Fig.1 Overview of the Weihe River Basin
数据类型 Data type | 变量 Variant | 空间分辨率 Spatial resolution | 来源 Source |
|---|---|---|---|
遥感生态指数 Remote sensing ecological index (RSEI) | 绿度Greenness | 500 m | https://ladsweb.modaps.eosdis.nasa.gov/MOD13A1_v6 |
| 湿度Wetness | 500 m | https://ladsweb.modaps.eosdis.nasa.gov/MOD09A1_v6 | |
| 干度Dryness | 500 m | https://ladsweb.modaps.eosdis.nasa.gov/MOD09A1_v6 | |
| 热度Heat | 1 km | https://ladsweb.modaps.eosdis.nasa.gov/MOD11A2_v6 | |
气候和土壤 Climate and soils | 降水量Precipitation (PRE) | 1 km | https://data.tpdc.ac.cn |
| 温度Temperature (TMP) | 1 km | https://data.tpdc.ac.cn | |
| 相对湿度Relative humidity (RH) | 1 km | https://data.tpdc.ac.cn | |
| 实际蒸散发Actual evapotranspiration (AET) | 1 km | https://data.tpdc.ac.cn | |
| 潜在蒸散发Potential evapotranspiration (PET) | 1 km | https://data.tpdc.ac.cn | |
| 地表温度Land surface temperature (LST) | 1 km | https://data.tpdc.ac.cn | |
| 土壤湿度Soil moisture (SM) | 1 km | https://data.tpdc.ac.cn | |
| 土地覆盖Land cover (LC) | 500 m | https://ladsweb.modaps.eosdis.nasa.gov/MCD12Q1_061 | |
| 地形Topography | 数字高程模型Digital elevation model (DEM) | 30 m | https://www.ncdc.ac.cn |
| 坡度Slope | 30 m | 从高程数据中提取Extraction from elevation data | |
| 社会经济和人类活动Socio-economic and human activities | 人口密度Density of population (DOP) | 100 m | https://hub.worldpop.org |
| 国内生产总值Gross domestic product (GDP) | 1 km | https://www.resdc.cn | |
| 夜间灯光指数Nighttime light index (NL) | 1 km | https://lpdaac.usgs.gov/ | |
| 人类足迹Human footprint (HFP) | 1 km | https://www.x-mol.com/groups/li_xuecao/news/48145 |
Table 1 Data sets and sources
数据类型 Data type | 变量 Variant | 空间分辨率 Spatial resolution | 来源 Source |
|---|---|---|---|
遥感生态指数 Remote sensing ecological index (RSEI) | 绿度Greenness | 500 m | https://ladsweb.modaps.eosdis.nasa.gov/MOD13A1_v6 |
| 湿度Wetness | 500 m | https://ladsweb.modaps.eosdis.nasa.gov/MOD09A1_v6 | |
| 干度Dryness | 500 m | https://ladsweb.modaps.eosdis.nasa.gov/MOD09A1_v6 | |
| 热度Heat | 1 km | https://ladsweb.modaps.eosdis.nasa.gov/MOD11A2_v6 | |
气候和土壤 Climate and soils | 降水量Precipitation (PRE) | 1 km | https://data.tpdc.ac.cn |
| 温度Temperature (TMP) | 1 km | https://data.tpdc.ac.cn | |
| 相对湿度Relative humidity (RH) | 1 km | https://data.tpdc.ac.cn | |
| 实际蒸散发Actual evapotranspiration (AET) | 1 km | https://data.tpdc.ac.cn | |
| 潜在蒸散发Potential evapotranspiration (PET) | 1 km | https://data.tpdc.ac.cn | |
| 地表温度Land surface temperature (LST) | 1 km | https://data.tpdc.ac.cn | |
| 土壤湿度Soil moisture (SM) | 1 km | https://data.tpdc.ac.cn | |
| 土地覆盖Land cover (LC) | 500 m | https://ladsweb.modaps.eosdis.nasa.gov/MCD12Q1_061 | |
| 地形Topography | 数字高程模型Digital elevation model (DEM) | 30 m | https://www.ncdc.ac.cn |
| 坡度Slope | 30 m | 从高程数据中提取Extraction from elevation data | |
| 社会经济和人类活动Socio-economic and human activities | 人口密度Density of population (DOP) | 100 m | https://hub.worldpop.org |
| 国内生产总值Gross domestic product (GDP) | 1 km | https://www.resdc.cn | |
| 夜间灯光指数Nighttime light index (NL) | 1 km | https://lpdaac.usgs.gov/ | |
| 人类足迹Human footprint (HFP) | 1 km | https://www.x-mol.com/groups/li_xuecao/news/48145 |
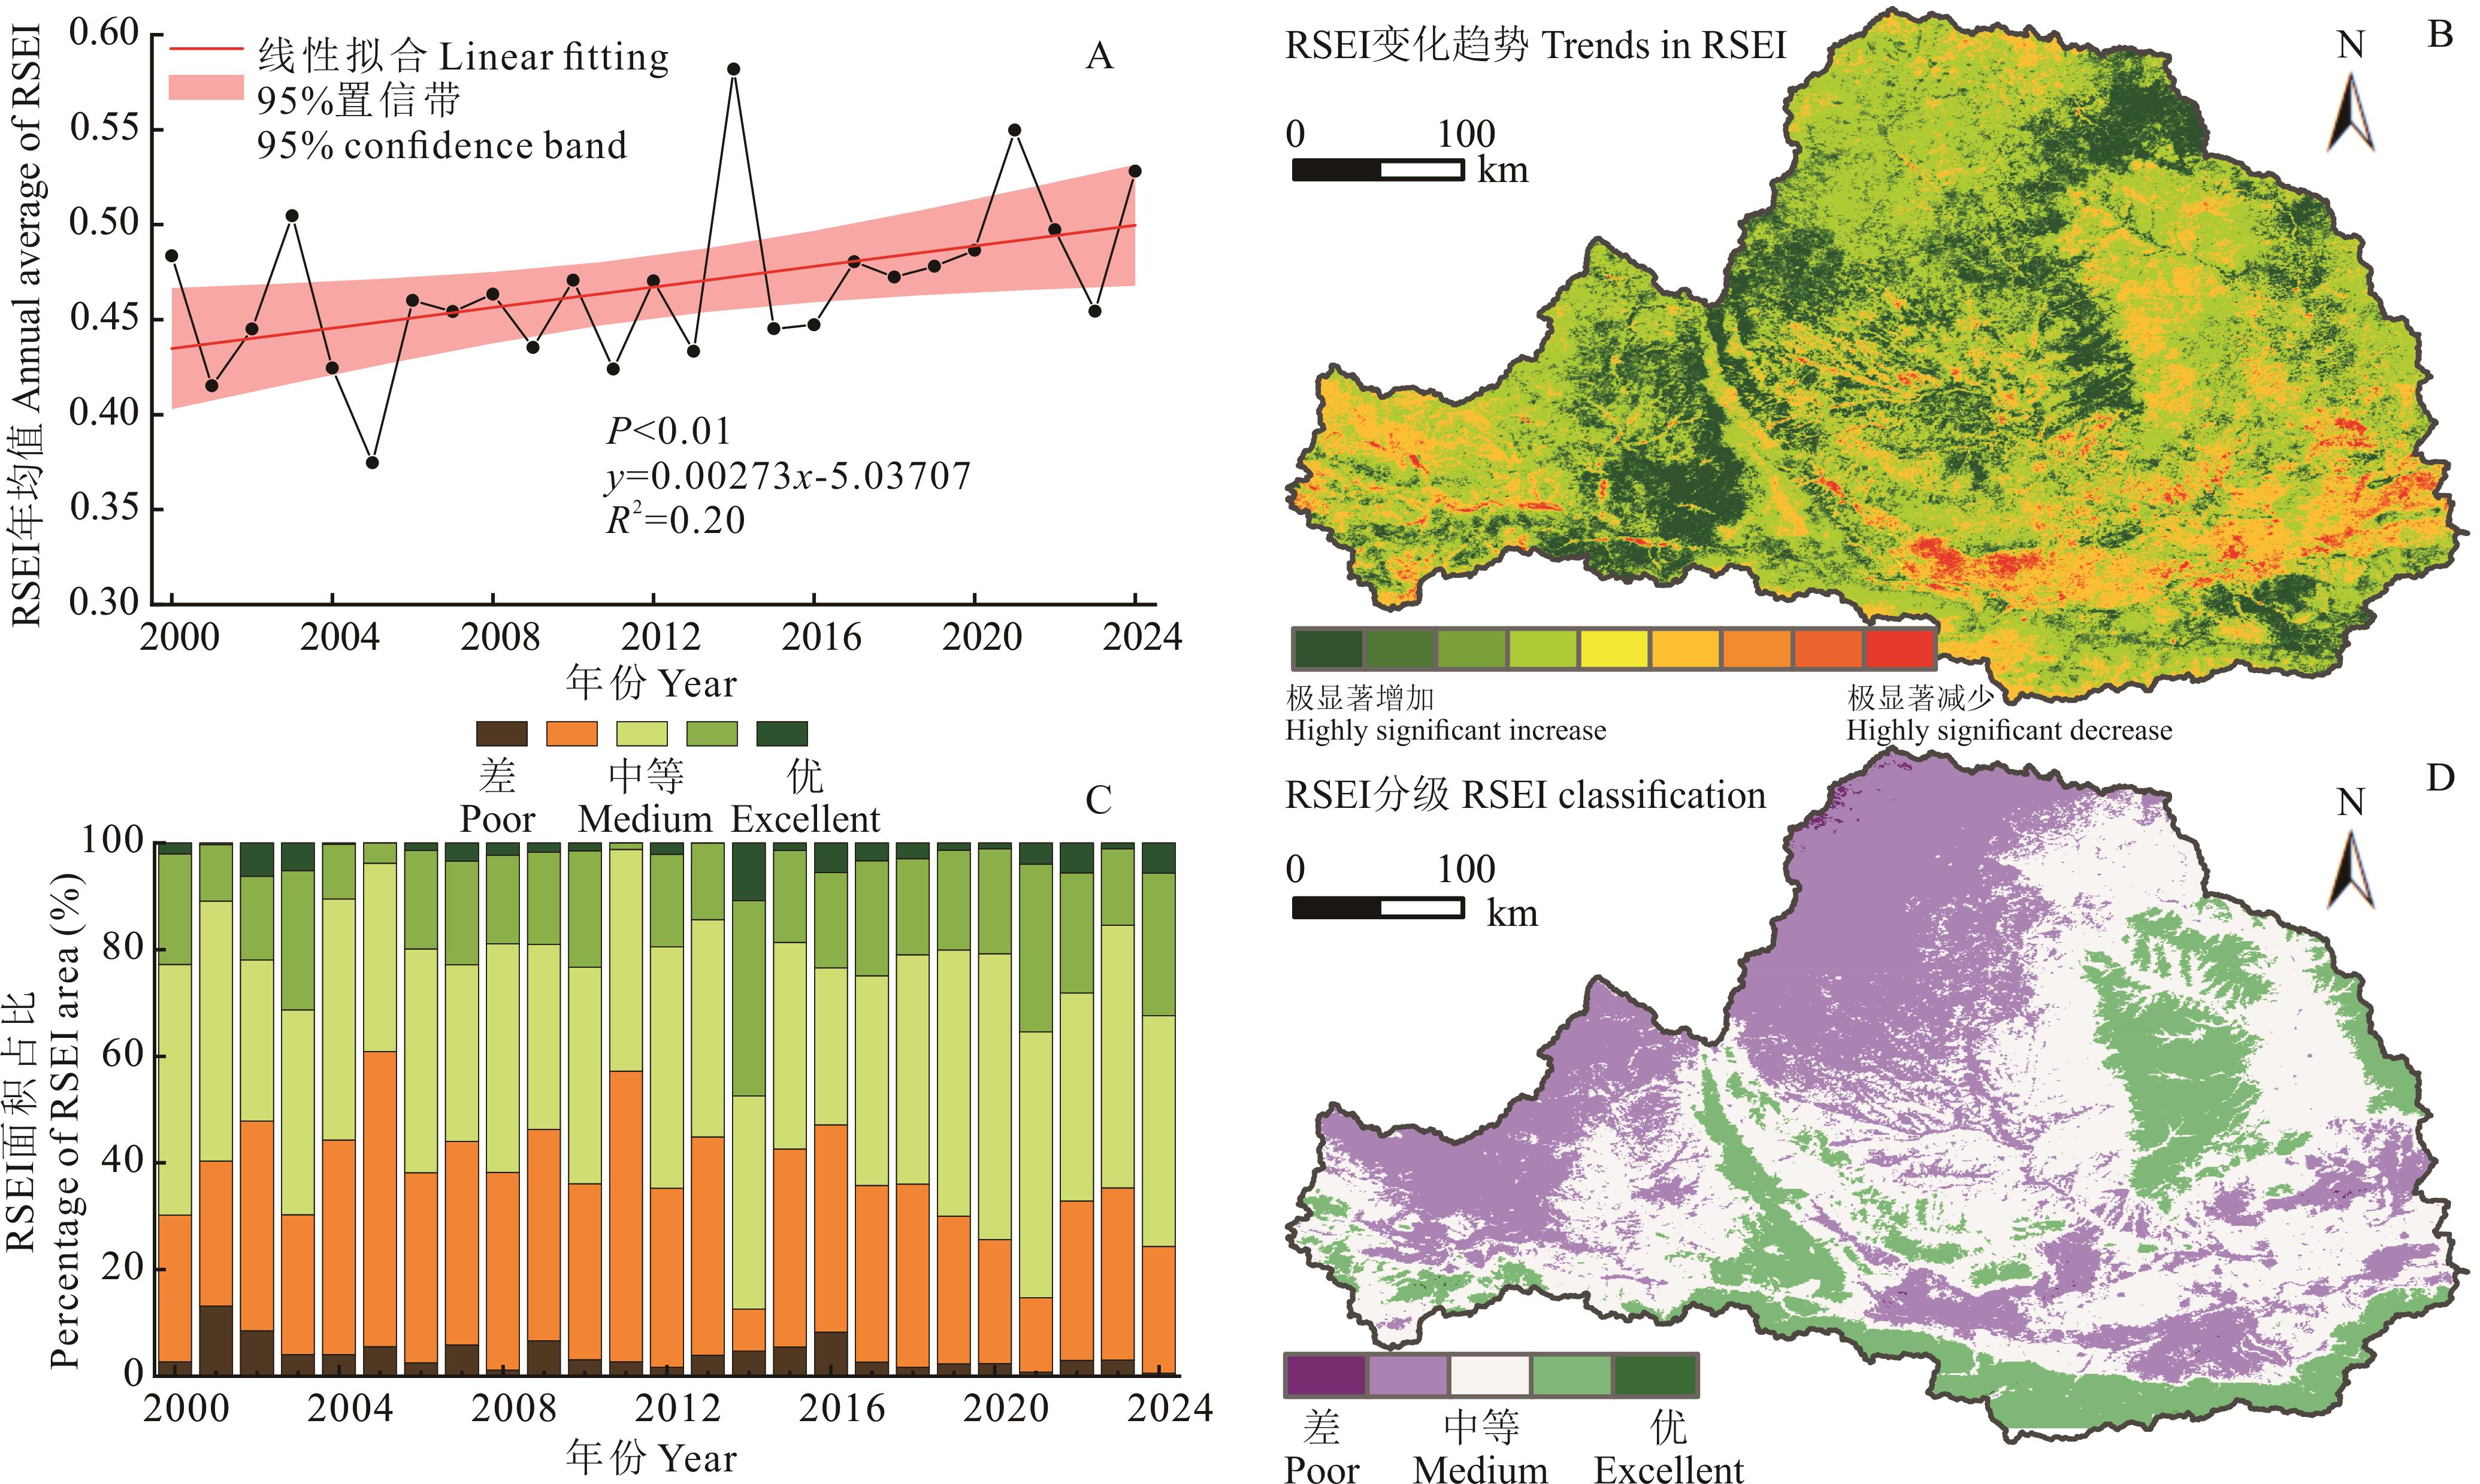
Fig.2 Changes in RSEI in the Weihe River Basin of 2000-2024
| RSEI趋势变化Changes in RSEI trends | SRSEI | Z值Z-value | 面积占比Percentage of area (%) |
|---|---|---|---|
| 极显著增加Extremely significant increase | ≥0.0005 | ≥2.580 | 11.63 |
| 显著增加Significant increase | ≥0.0005 | 1.960~2.580 | 11.35 |
| 微显著增加Slightly significant increase | ≥0.0005 | 1.645~1.960 | 8.27 |
| 不显著增加Non-significant increase | ≥0.0005 | 0~1.645 | 46.72 |
| 无变化No change | -0.0005~0.0005 | - | 0.01 |
| 不显著减少Non-significant decrease | ≤-0.0005 | -1.645~0 | 19.09 |
| 微显著减少Slightly significant decrease | ≤-0.0005 | -1.960~-1.645 | 1.09 |
| 显著减少Significant decrease | ≤-0.0005 | -2.580~-1.960 | 1.18 |
| 极显著减少Extremely significant decrease | ≤-0.0005 | ≤-2.580 | 0.66 |
Table 2 Trends of RSEI in the Weihe River Basin
| RSEI趋势变化Changes in RSEI trends | SRSEI | Z值Z-value | 面积占比Percentage of area (%) |
|---|---|---|---|
| 极显著增加Extremely significant increase | ≥0.0005 | ≥2.580 | 11.63 |
| 显著增加Significant increase | ≥0.0005 | 1.960~2.580 | 11.35 |
| 微显著增加Slightly significant increase | ≥0.0005 | 1.645~1.960 | 8.27 |
| 不显著增加Non-significant increase | ≥0.0005 | 0~1.645 | 46.72 |
| 无变化No change | -0.0005~0.0005 | - | 0.01 |
| 不显著减少Non-significant decrease | ≤-0.0005 | -1.645~0 | 19.09 |
| 微显著减少Slightly significant decrease | ≤-0.0005 | -1.960~-1.645 | 1.09 |
| 显著减少Significant decrease | ≤-0.0005 | -2.580~-1.960 | 1.18 |
| 极显著减少Extremely significant decrease | ≤-0.0005 | ≤-2.580 | 0.66 |

Fig.3 Variable coefficient (A) and predicted future trends of RSEI (B) in the Weihe River Basin of 2000-2024
| Fold | 确定系数 R2 | 均方根误差 Root mean square error (RMSE) | 平均绝对误差 Mean absolute error (MAE) |
|---|---|---|---|
| 1 | 0.7590 | 0.0680 | 0.0520 |
| 2 | 0.7630 | 0.0670 | 0.0510 |
| 3 | 0.7580 | 0.0680 | 0.0510 |
| 4 | 0.7600 | 0.0670 | 0.0510 |
| 5 | 0.7590 | 0.0690 | 0.0520 |
| 均值±标准差Mean±SD | 0.7598±0.0019 | 0.0676±0.0008 | 0.0513±0.0005 |
Table 3 Model robustness validation: 5-fold cross-validation results
| Fold | 确定系数 R2 | 均方根误差 Root mean square error (RMSE) | 平均绝对误差 Mean absolute error (MAE) |
|---|---|---|---|
| 1 | 0.7590 | 0.0680 | 0.0520 |
| 2 | 0.7630 | 0.0670 | 0.0510 |
| 3 | 0.7580 | 0.0680 | 0.0510 |
| 4 | 0.7600 | 0.0670 | 0.0510 |
| 5 | 0.7590 | 0.0690 | 0.0520 |
| 均值±标准差Mean±SD | 0.7598±0.0019 | 0.0676±0.0008 | 0.0513±0.0005 |
指标 Index | 训练集 Training set | 测试集 Test set | Δ(测试-训练Test-training) |
|---|---|---|---|
| R2 | 0.7668 | 0.7598 | -0.0070 |
| RMSE | 0.0662 | 0.0676 | +0.0014 |
| MAE | 0.0492 | 0.0513 | +0.0022 |
Table 4 Model robustness validation: training-test variances
指标 Index | 训练集 Training set | 测试集 Test set | Δ(测试-训练Test-training) |
|---|---|---|---|
| R2 | 0.7668 | 0.7598 | -0.0070 |
| RMSE | 0.0662 | 0.0676 | +0.0014 |
| MAE | 0.0492 | 0.0513 | +0.0022 |
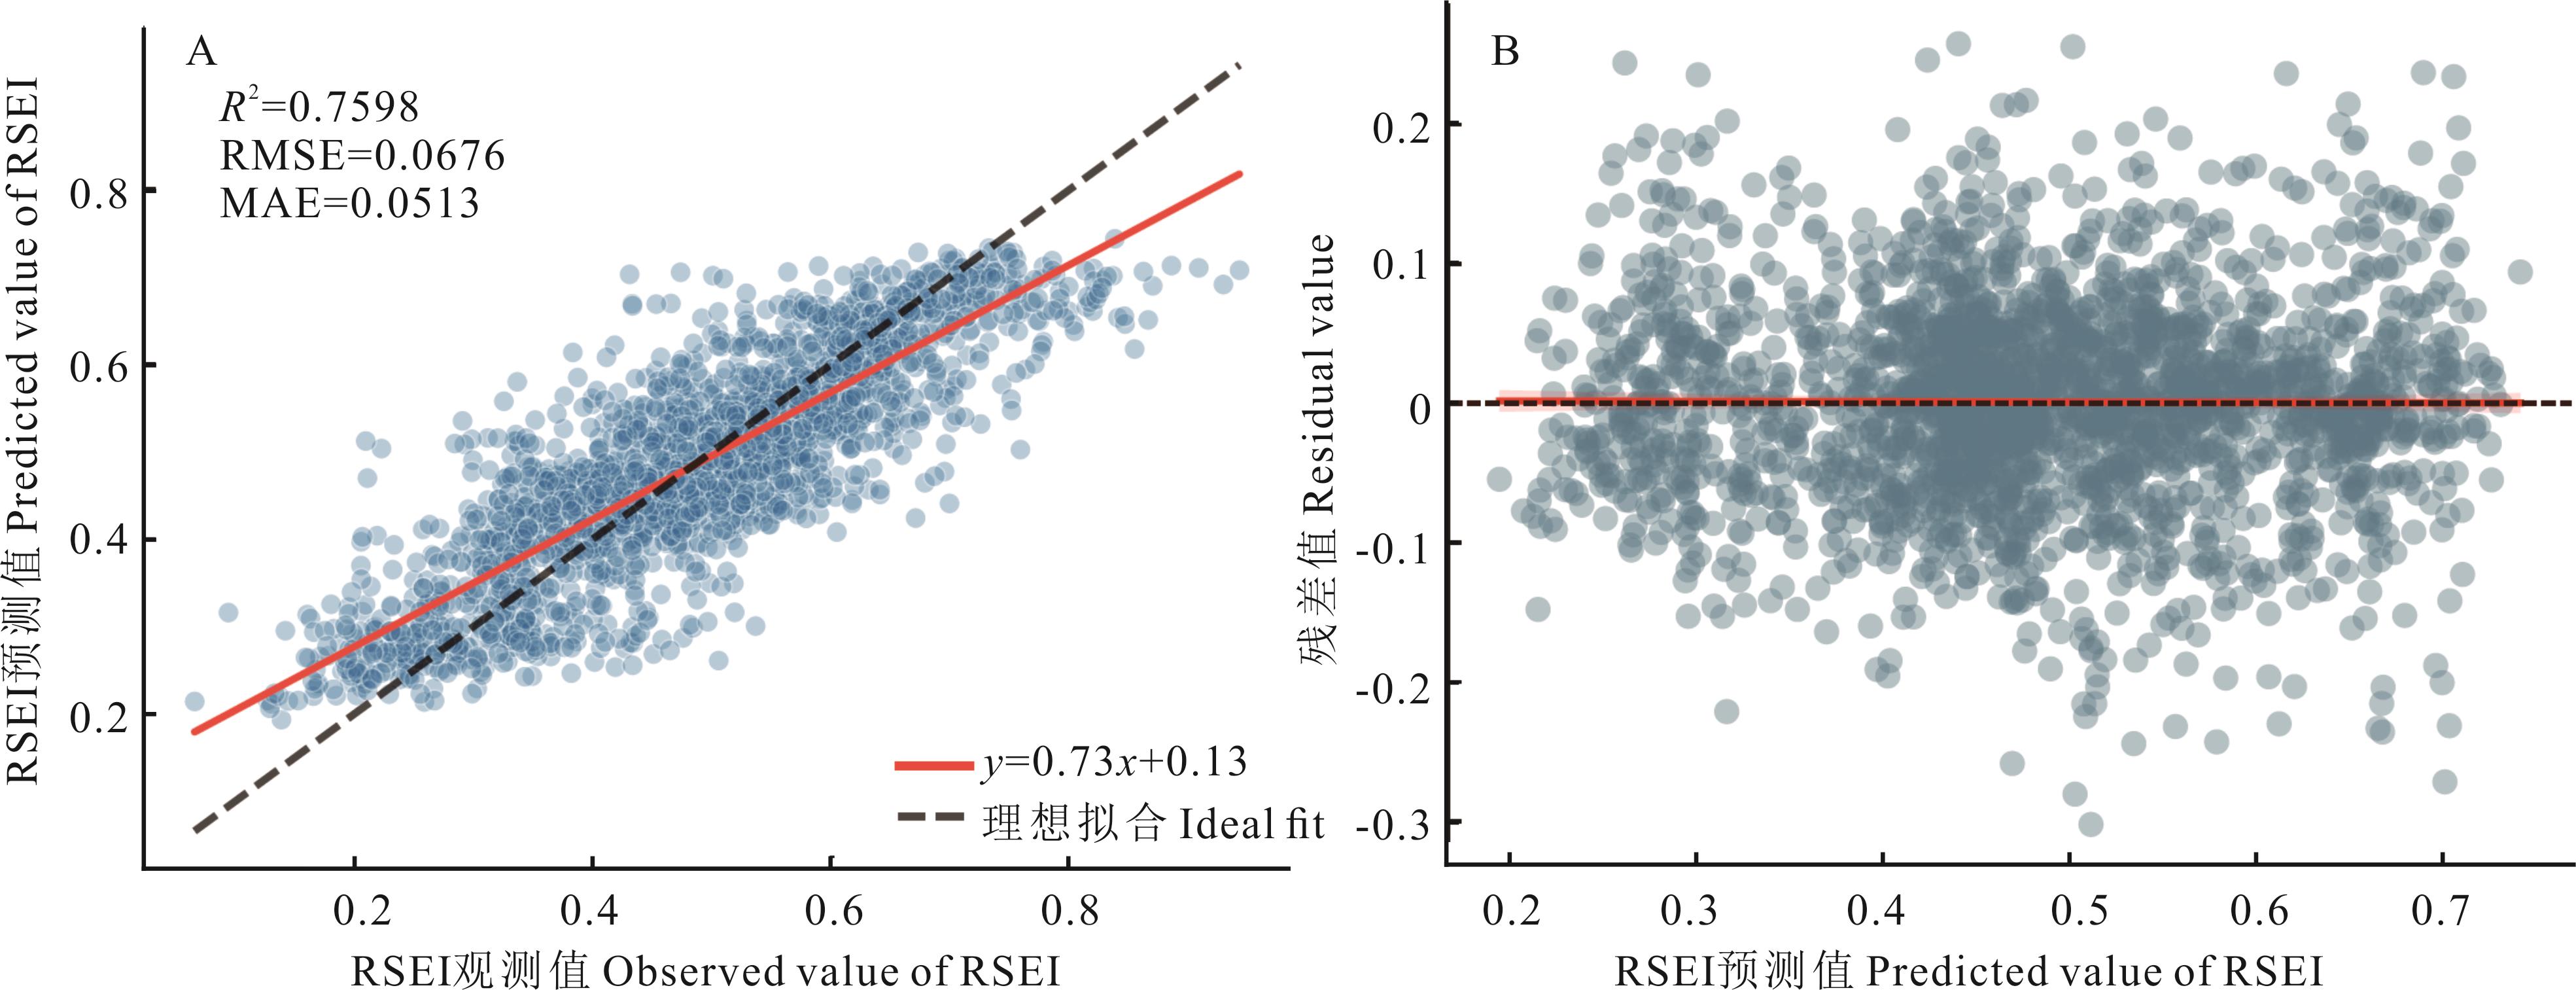
Fig.4 Evaluation of RSEI prediction accuracy for the test set of XGBoost model: observed values vs. predicted values (A) and their residual distributions (B)
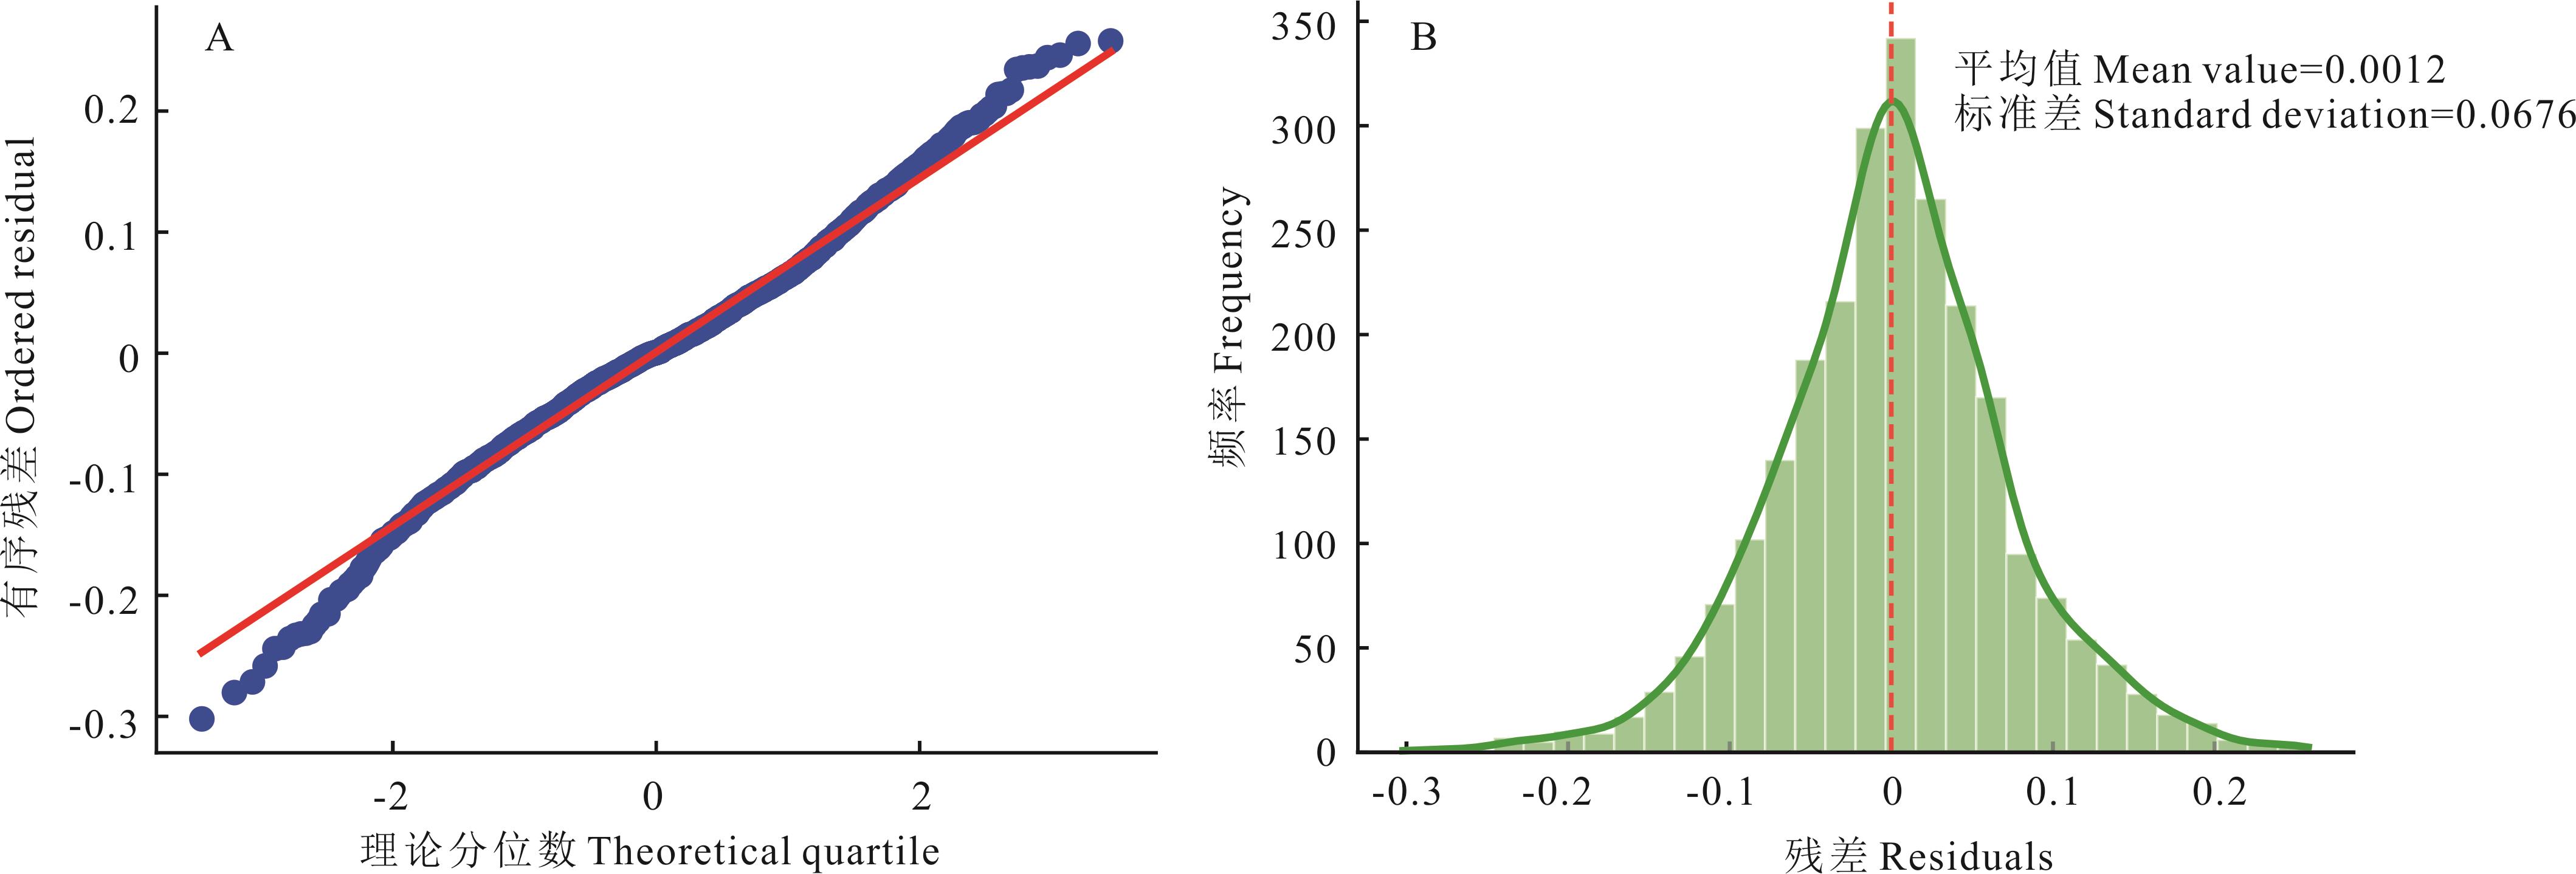
Fig.5 XGBoost model test set residual normality test: Q-Q plot (A) and histogram of residual distribution (B)
层级 Level | 特征 Characterization | 平均绝对SHAP值 Mean |SHAP| | 累积贡献率 Cumulative contribution |
|---|---|---|---|
| 一级驱动Primary drivers | AET, LST | 0.0558, 0.0337 | 0.0895 |
| 二级驱动Secondary drivers | PET, DOP, TMP, PRE | 0.0259, 0.0239, 0.0207, 0.0113 | 0.0819 |
| 三级驱动Three-stage drivers | DEM, LC, RH, SM, HFP, GDP, SLOPE, NL | <0.010 | 0.0280 |
Table 5 Hierarchical division of feature importance
层级 Level | 特征 Characterization | 平均绝对SHAP值 Mean |SHAP| | 累积贡献率 Cumulative contribution |
|---|---|---|---|
| 一级驱动Primary drivers | AET, LST | 0.0558, 0.0337 | 0.0895 |
| 二级驱动Secondary drivers | PET, DOP, TMP, PRE | 0.0259, 0.0239, 0.0207, 0.0113 | 0.0819 |
| 三级驱动Three-stage drivers | DEM, LC, RH, SM, HFP, GDP, SLOPE, NL | <0.010 | 0.0280 |
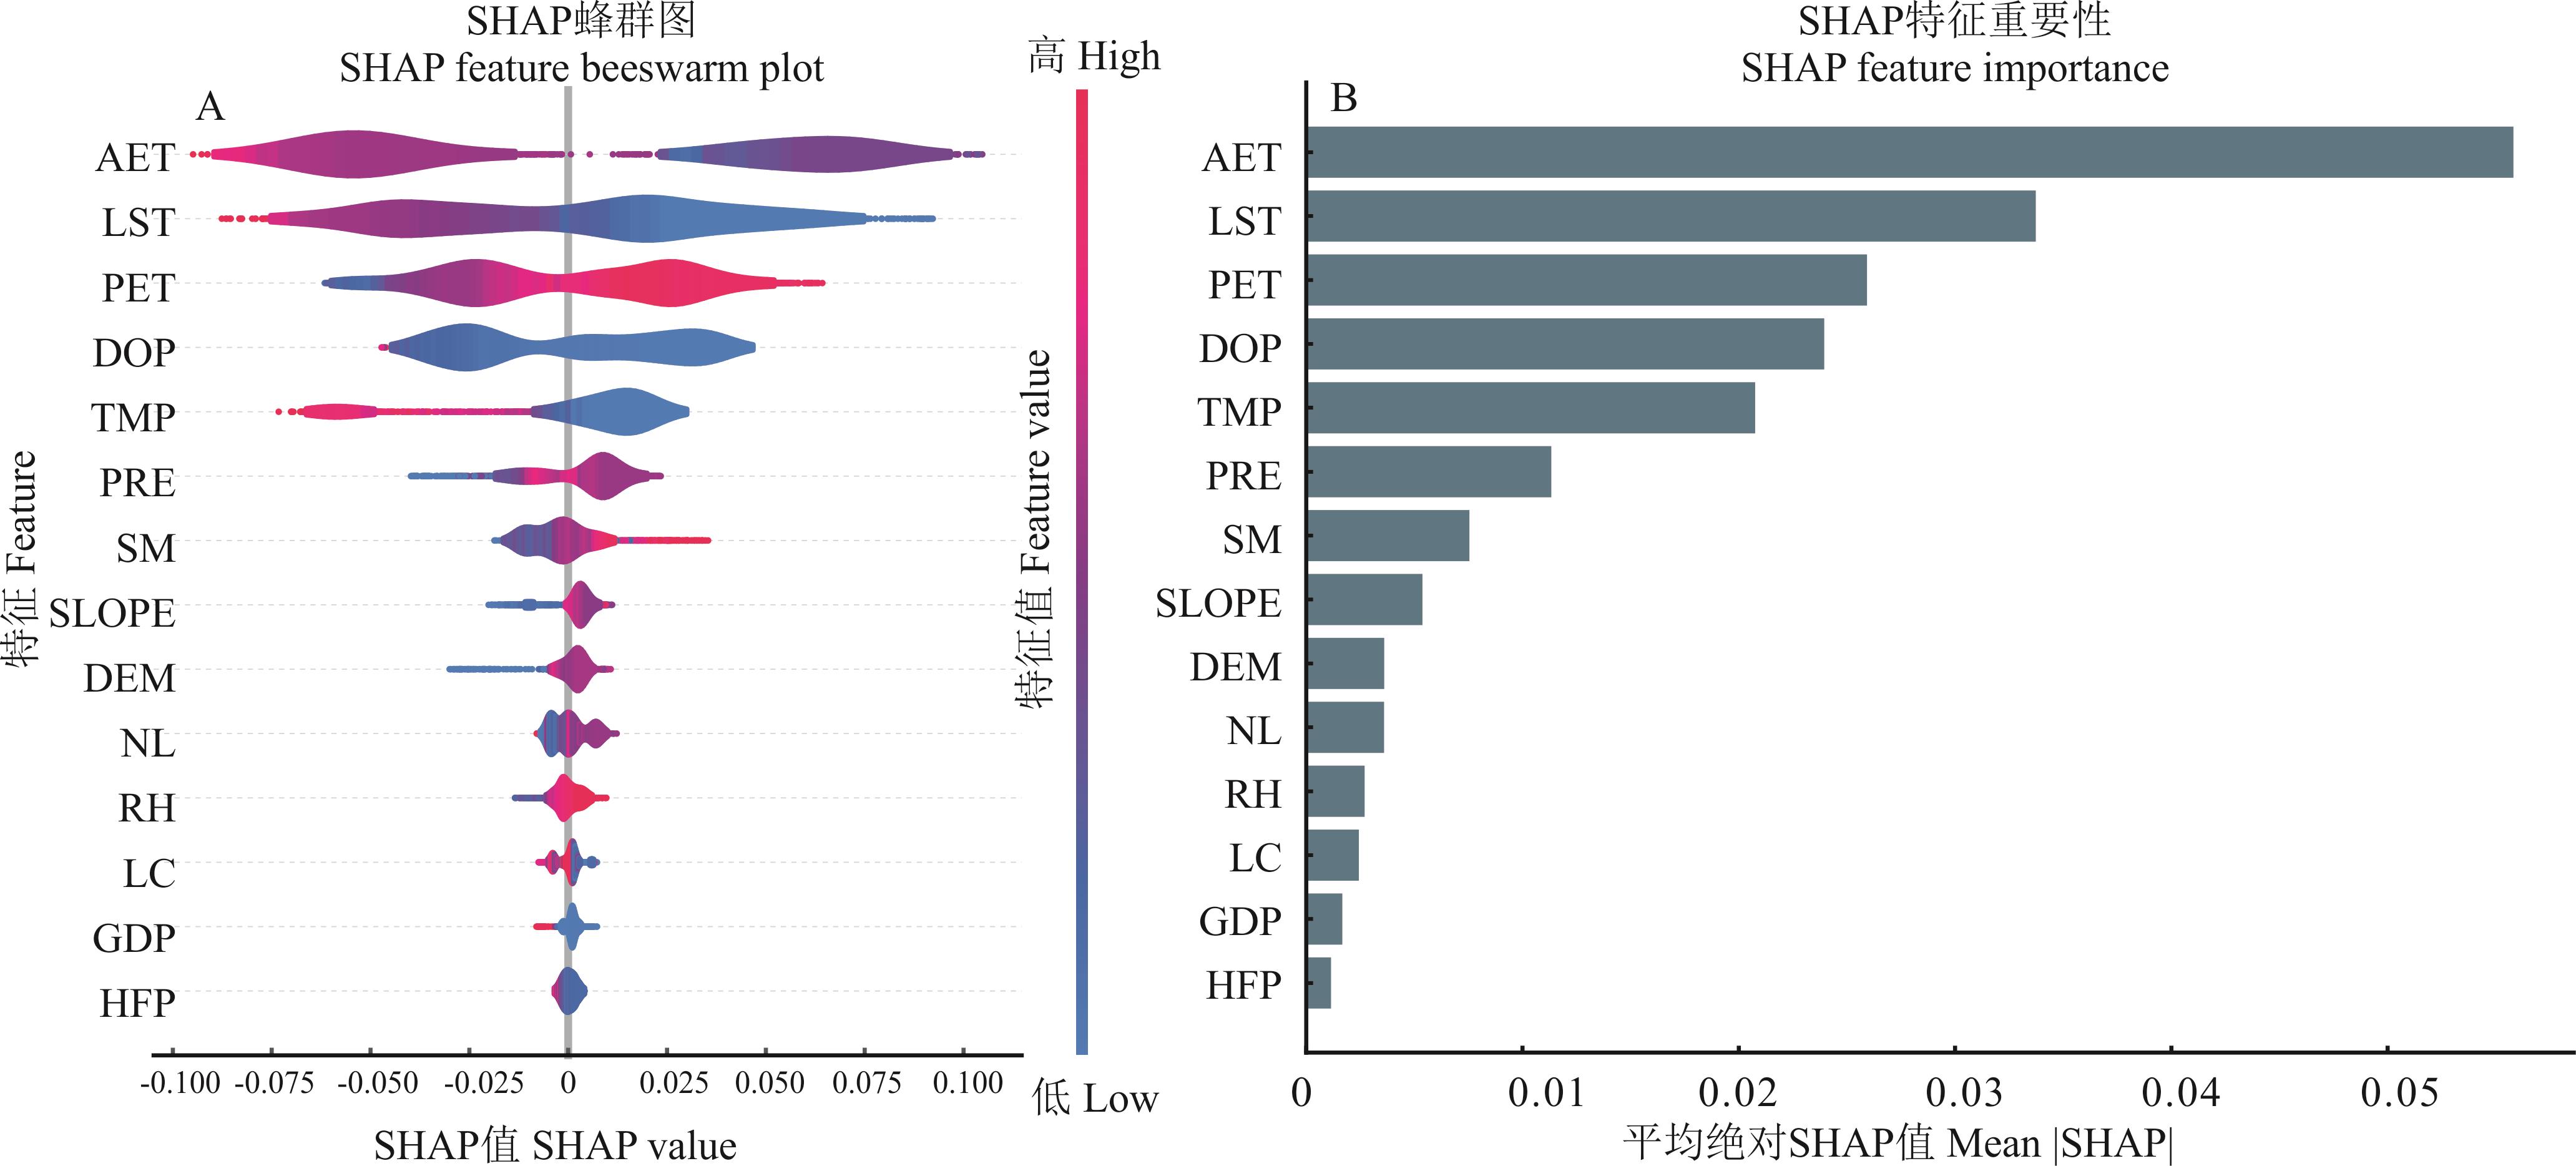
Fig.6 SHAP-based XGBoost model contribution direction (A) and feature importance ranking (B) (test set)
特征 Feature | 平均绝对SHAP值 Mean |SHAP| | 相对贡献率 Relative contribution (%) | 表现过程 Embodiment process |
|---|---|---|---|
| 气候Climate | 0.0225 | 60.84 | 主导水分-能量平衡Dominant moisture-energy balance |
| 社会经济Socioeconomic | 0.0075 | 20.48 | 人类活动与压力Human activities and stress |
| 静态特征Static feature | 0.0044 | 12.11 | 背景生境条件Background habitat conditions |
| 土地利用 Land use | 0.0024 | 6.57 | 土地覆被与利用Land cover and use |
Table 6 Importance analysis of feature types
特征 Feature | 平均绝对SHAP值 Mean |SHAP| | 相对贡献率 Relative contribution (%) | 表现过程 Embodiment process |
|---|---|---|---|
| 气候Climate | 0.0225 | 60.84 | 主导水分-能量平衡Dominant moisture-energy balance |
| 社会经济Socioeconomic | 0.0075 | 20.48 | 人类活动与压力Human activities and stress |
| 静态特征Static feature | 0.0044 | 12.11 | 背景生境条件Background habitat conditions |
| 土地利用 Land use | 0.0024 | 6.57 | 土地覆被与利用Land cover and use |

Fig.7 Characteristic variables SHAP values and RSEI with their partial dependencies

Fig.8 Interaction effect of the top 6 key features based on SHAP values
| [1] | Sun C F, Li Q, Liu Y, et al. Human activities have more impacts on the recent discharge reduction of the largest tributary of the Yellow River relative to last three centuries. Science of the Total Environment, 2023, 890: 164217-164225. |
| [2] | Liu W. Variation in water deficit and its association with climate indices in Weihe River Basin, China. Atmosphere, 2024, 15(3): 339. |
| [3] | Cui Y, Wang Y, Lü Y, et al.Comparative study on industrial coordinated development of urban agglomerations in western China: take Chengdu-Chongqing and Guanzhong Plain Urban Agglomerations as an example. Journal of Xi’an University of Technology, 2024, 40(1): 45-55. |
| 崔琰, 王英, 吕园, 等. 西部城市群产业协同发展研究——以成渝和关中平原城市群为例. 西安理工大学学报, 2024, 40(1): 45-55. | |
| [4] | Roche P K, Campagne C S. From ecosystem integrity to ecosystem condition: A continuity of concepts supporting different aspects of ecosystem sustainability. Current Opinion in Environmental Sustainability, 2017, 29: 63-68. |
| [5] | Berger A R, Hodge R A. Natural change in the environment: A challenge to the pressure-state-response concept. Social Indicators Research, 1998, 44(2): 255-265. |
| [6] | Huang B, Shao J B, Meng W J, et al. Assessment on environmental quality of estuary ecosystem of Jiaojiang River based on press-state-response model. Wetland Science, 2016, 14(6): 825-831. |
| 黄备, 邵君波, 孟伟杰, 等. 利用PSR模型的椒江河口生态系统环境质量评价. 湿地科学, 2016, 14(6): 825-831. | |
| [7] | Khatun R, Das S. Exploring ecosystem health of wetlands in Rarh tract of West Bengal through V-O-R model. Ecological Informatics, 2022, 72: 101840. |
| [8] | Zhou Q G, Peng C H, Liu X W, et al. Ecosystem health assessment of water level fluctuating zone in Three Gorges Reservoir Area based on VOR model. Research of Soil and Water Conservation, 2022, 29(5): 310-318. |
| 周启刚, 彭春花, 刘栩位, 等. 基于VOR模型的三峡库区消落带2010-2020年生态系统健康评价. 水土保持研究, 2022, 29(5): 310-318. | |
| [9] | Xu H Q. A remote sensing urban ecological index and its application. Acta Ecologica Sinica, 2013, 33(24): 7853-7862. |
| 徐涵秋. 城市遥感生态指数的创建及其应用. 生态学报, 2013, 33(24): 7853-7862. | |
| [10] | Xu Y J, Yang X C, Xing X Y, et al. Coupling eco-environmental quality and ecosystem services to delineate priority ecological reserves-A case study in the Yellow River Basin. Journal of Environmental Management, 2024, 365: 121645. |
| [11] | Li R Z. Dynamic assessment on regional eco-environmental quality using AHP-statistics model-A case study of Chaohu Lake Basin. Chinese Geographical Science, 2007, 17(4): 341-348. |
| [12] | Amindin A, Blaschke T, Bordbar M, et al. Leveraging GEE and machine learning algorithm in dynamic modeling of eco-environmental quality. Environmental and Sustainability Indicators, 2025, 27: 100818. |
| [13] | Shi T T, Xu H Q, Sun F Q, et al. Remote-sensing-based assessment of regional ecological changes triggered by a construction project: a case study of Aojiang River Watershed. Acta Ecologica Sinica, 2019, 39(18): 6687-6696. |
| 施婷婷, 徐涵秋, 孙凤琴, 等. 建设项目引发的区域生态变化的遥感评估——以敖江流域为例. 生态学报, 2019, 39(18): 6687-6696. | |
| [14] | Liu Y, Xu W H, Hong Z H, et al. Integrating three-dimensional greenness into RSEI improved the scientificity of ecological environment quality assessment for forest. Ecological Indicators, 2023, 156: 111092. |
| [15] | Miao W N, Chen Y, Kou W L, et al. The HANTS-fitted RSEI constructed in the vegetation growing season reveals the spatiotemporal patterns of ecological quality. Scientific Reports, 2024, 14(1): 14686. |
| [16] | She H, Li P, Wang X K, et al. Spatial and temporal changes and its driving factors of ecological environment quality in Weihe River basin from 2000 to 2020. Bulletin of Soil and Water Conservation, 2025, 45(1): 317-326. |
| 佘欢, 李鹏, 王孝康, 等. 2000-2020年渭河流域生态环境质量时空变化及其驱动因素. 水土保持通报, 2025, 45(1): 317-326. | |
| [17] | Sagi O, Rokach L. Approximating XGBoost with an interpretable decision tree. Information Sciences, 2021, 572: 522-542. |
| [18] | Li Y Y, Chang J X, Wang Y M, et al. Spatiotemporal responses of runoff to land use change in Wei River Basin. Transactions of the Chinese Society of Agricultural Engineering, 2016, 32(15): 232-238. |
| 黎云云, 畅建霞, 王义民, 等. 渭河流域径流对土地利用变化的时空响应. 农业工程学报, 2016, 32(15): 232-238. | |
| [19] | Xu H Q. A remote sensing index for assessment of regional ecological changes. China Environmental Science, 2013, 33(5): 889-897. |
| 徐涵秋. 区域生态环境变化的遥感评价指数. 中国环境科学, 2013, 33(5): 889-897. | |
| [20] | Xu W J, Song J X, Long Y Q, et al. Analysis and simulation of the driving mechanism and ecological effects of land cover change in the Weihe River Basin, China. Journal of Environmental Management, 2023, 344: 118320. |
| [21] | Hou Y P, Long B, Liu G, et al. Study on the ecological environmental spatio-temporal evolution in the Gansu section of the Weihe River basin. Environmental Ecology, 2024, 6(5): 19-26. |
| 侯亚鹏, 龙斌, 刘高, 等. 渭河流域(甘肃段)生态环境质量时空演变. 环境生态学, 2024, 6(5): 19-26. | |
| [22] | Xu Y, Dai Q Y, Lu Y G, et al. Identification of ecologically sensitive zones affected by climate change and anthropogenic activities in southwest China through an NDVI-based spatial-temporal model. Ecological Indicators, 2024, 158: 111482. |
| [23] | Wang Y B, Zhang G Y, Liu Y Y, et al. Study on the evolution of vegetation pattern and its driving mechanism in Yanhe River Basin. Journal of Ecology and Rural Environment, 2024, 40(8): 985-995. |
| 王亦波, 张格语, 刘洋洋, 等. 延河流域植被格局演变及其驱动机制研究. 生态与农村环境学报, 2024, 40(8): 985-995. | |
| [24] | Tong S Q, Zhang J Q, Bao Y H, et al. Analyzing vegetation dynamic trend on the Mongolian Plateau based on the Hurst exponent and influencing factors from 1982-2013. Journal of Geographical Sciences, 2018, 28(5): 595-610. |
| [25] | Xiao T, Wang C Z, Feng M, et al. Dynamic changes in grassland coverage in the Sanjiangyuan region of Qinghai from 2000 to 2011. Acta Agrestia Sinica, 2014, 22(1): 39-45. |
| 肖桐, 王昌佐, 冯敏, 等. 2000-2011 年青海三江源地区草地覆盖度的动态变化特征. 草地学报, 2014, 22(1): 39-45. | |
| [26] | Huang Y, Song H Q, Wu H, et al. Spatiotemporal dynamics of vegetation carbon use efficiency and its relationship with hydrothermal factors in Inner Mongolia Autonomous Region. Bulletin of Soil and Water Conservation, 2024, 44(5): 358-368. |
| 皇彦, 宋海清, 吴昊, 等. 内蒙古自治区植被碳利用效率时空动态及其与水热因子的关系. 水土保持通报, 2024, 44(5): 358-368. | |
| [27] | Wu X, Zhang X Y, Long A C, et al. Revealing the drivers of land surface temperature variation in Guiyang City using XGBoost and SHAP. Environmental Science and Technology, 2024, 47(8): 155-166. |
| 吴雪, 张显云, 龙安成, 等. 采用XGBoost+SHAP揭示贵阳市地表温度的驱动力因子. 环境科学与技术, 2024, 47(8): 155-166. | |
| [28] | Takefuji Y. Beyond XGBoost and SHAP: Unveiling true feature importance. Journal of Hazardous Materials, 2025, 488: 137382. |
| [29] | Li W Q, Xie J C, Li J X, et al. Watershed ecological compensation allocation method based on improved Shapley value solution. Systems Engineering-Theory & Practice, 2013, 33(1): 255-261. |
| 李维乾, 解建仓, 李建勋, 等. 基于改进Shapley值解的流域生态补偿额分摊方法. 系统工程理论与实践, 2013, 33(1): 255-261. | |
| [30] | Zhao J J, Wang K. How to apply interpretable machine learning methods to prediction research in public administration?-A case study on economies of scale in local governments. Chinese Public Administration, 2025, 41(3): 76-89. |
| 赵聚军, 王坤. 可解释机器学习如何应用于公共管理中的预测研究——以地方政府规模经济效应为例. 中国行政管理, 2025, 41(3): 76-89. | |
| [31] | Das P, Kashem A. Hybrid machine learning approach to prediction of the compressive and flexural strengths of UHPC and parametric analysis with Shapley additive explanations. Case Studies in Construction Materials, 2024, 20: e02723. |
| [32] | Moretti S, Patrone F. Transversality of the Shapley value. TOP, 2008, 16(1): 1-41. |
| [33] | Lanitis A, Taylor C J, Cootes T F. A unified approach to coding and interpreting face images//Proceedings of the 5th IEEE International Conference on Computer Vision. Cambridge: IEEE Press, 1995: 368-373. |
| [34] | Lundberg S M, Erion G, Chen H, et al. From local explanations to global understanding with explainable AI for trees. Nature Machine Intelligence, 2020, 2(1): 56-67. |
| [35] | Bakas I, Kontoleon K J. ANNs and game theory SHAP algorithms quantifying the contribution of geometric and temperature-dependent material properties to the thermal response of concrete walls exposed to elevated temperatures. Construction and Building Materials, 2025, 493: 143121. |
| [36] | He Z X, Geng G P, Zheng R L. Variation characteristics and its driving forces of fractional vegetation cover in the Shaanxi section of the Yellow River Basin under the background of the grain for green program. Environmental Science, 2025, 46(2): 1-19. |
| 何祖鑫, 耿广坡, 郑若琳. 退耕还林还草背景下黄河流域陕西段植被覆盖度变化特征及驱动力分析. 环境科学, 2025, 46(2): 1-19. | |
| [37] | He H J, Wang Z, Dong J F, et al. Synergy and trade-off between vegetation change and urbanization development in the Yellow River Basin of Shaanxi Province based on satellite remote sensing data. Acta Ecologica Sinica, 2022, 42(9): 3536-3545. |
| 何慧娟, 王钊, 董金芳, 等. 陕西黄河流域植被变化与城镇化协同权衡关系研究——基于卫星遥感数据. 生态学报, 2022, 42(9): 3536-3545. | |
| [38] | Wang B, Yue D P, Zhang J. “Harmonizing the north and south, benefiting the world”: Geoscientific interpretation of the ecological significance of the Qinling Mountains. Geography Education, 2022(12): 3-8. |
| 王斌, 岳大鹏, 张瑾. “和合南北、泽被天下”: 秦岭生态意义的地学解读. 地理教育, 2022(12): 3-8. | |
| [39] | Guo X D. Research on rural settlement development and spatial structure in Loess Hilly Area. Lanzhou: Lanzhou University, 2007.郭晓东. 黄土丘陵区乡村聚落发展及其空间结构研究. 兰州: 兰州大学, 2007. |
| [40] | Lei Z D. Conform and restructure. Xi’an: Xi’an University of Architecture and Technology, 2005.雷振东. 整合与重构. 西安: 西安建筑科技大学, 2005. |
| [41] | Chen J H. The response of ecological environment quality in Guanzhong Region to the expansion of urban and rural construction land. Xi’an: Chang’an University, 2023.陈锦鸿. 关中地区生态环境质量对城乡建设用地扩张的响应研究. 西安: 长安大学, 2023. |
| [42] | Li Z S, Yang L, Wang G L, et al. The management of soil and water conservation in the Loess Plateau of China: Present situations, problems, and counter-solutions. Acta Ecologica Sinica, 2019, 39(20): 7398-7409. |
| 李宗善, 杨磊, 王国梁, 等. 黄土高原水土流失治理现状、问题及对策. 生态学报, 2019, 39(20): 7398-7409. | |
| [43] | Chu H M, He S F, He J L, et al. Research on the spatiotemporal differentiation characteristics of urban ecological resilience in the Yellow River Basin based on PSR model. Research of Soil and Water Conservation, 2025, 32(4): 396-404. |
| 初慧敏, 贺山峰, 何佳临, 等. 基于 PSR 模型的黄河流域城市生态韧性时空分异特征研究. 水土保持研究, 2025, 32(4): 396-404. | |
| [44] | Wen G C, Wu B J, Wang L, et al. Analysis of eco-environmental geological problems and their driving forces in the Henan section of the Yellow River Basin, China. Sustainability, 2023, 15(8): 6818. |
| [45] | Wang B, Li P, Xu G C, et al. Temporal and spatial variation characteristics of annual temperature in China’s first-level basin. Resources Science, 2019, 41(1): 152-163. |
| 王斌, 李鹏, 徐国策, 等. 中国一级流域年气温的时空变化特征. 资源科学, 2019, 41(1): 152-163. | |
| [46] | Aizizi Y, Kasimu A, Liang H, et al. Evaluation of ecological space and ecological quality changes in urban agglomeration on the northern slope of the Tianshan Mountains. Ecological Indicators, 2023, 146: 109896. |
| [47] | Wang R F, Lyu B Q, Zhang W J. Vegetation dynamics and their responses to climate change in the Yellow River Basin: Based on climatic wet and dry zoning scales. Arid Land Geography, 2025, 48(6): 973-984. |
| 王瑞芳, 吕宝奇, 张文静. 黄河流域植被动态及其对气候变化的响应——基于气候干湿分区尺度. 干旱区地理, 2025, 48(6): 973-984. | |
| [48] | Huang Z Q. Partial least squares regression analysis to factor of influence for ecological footprint. Cluster Computing, 2019, 22(3): 6425-6433. |
| [49] | An Y H, Liu J, Zhang J Q, et al. Comparative researches on the provenance indicators of Huaihe River,Yangtze River and Yellow River sediments. Quaternary Sciences, 2020, 40(3): 837-850. |
| 安郁辉, 刘健, 张军强, 等. 淮河与长江和黄河沉积物的物源识别指标比较研究. 第四纪研究, 2020, 40(3): 837-850. | |
| [50] | Zhang P, Qi S, Lai J L, et al. Spatiotemporal changes and driving factors of ecological quality in the Jinsha River Basin based on RSEI. Environmental Science, 2025, 46(3): 1-18. |
| 张鹏, 齐实, 赖金林, 等. 基于RSEI的金沙江流域生态环境质量时空变化及驱动因素分析. 环境科学, 2025, 46(3): 1-18. | |
| [51] | Yu H J, Zhang F M, Ma H, et al. Spatio-temporal evolution and driving factors of ecological environment quality in the Huaihe River Basin based on RSEI. Environmental Science, 2024, 45(7): 4112-4121. |
| 余慧婕, 张方敏, 马赫, 等. 基于遥感生态指数的淮河流域生态环境质量时空演化及其驱动因素分析. 环境科学, 2024, 45(7): 4112-4121. | |
| [52] | Wang Y X, Xu Y Y, Yang J J, et al. Dynamic monitoring and spatio-temporal pattern evolution analysis of eco-environmental quality in Chongqing based on remote sensing. Acta Ecologica Sinica, 2023, 43(15): 6278-6292. |
| 王永祥, 徐园园, 杨佳嘉, 等. 基于Landsat的重庆市生态环境质量动态监测及其时空格局演变分析. 生态学报, 2023, 43(15): 6278-6292. | |
| [53] | Ma Y F, Li J P, Chen C S, et al. Spatial and temporal variation of remote sensing ecological index and its climate response in Changbai Mountains Region. Desert and Oasis Meteorology, 2023, 17(2): 91-97. |
| 马云飞, 李建平, 陈长胜, 等. 长白山地区遥感生态指数时空变化及其气候响应. 沙漠与绿洲气象, 2023, 17(2): 91-97. | |
| [54] | Chen J, Fang L X, Zhu C W. Sponge city construction in mountain park in the semi-arid areas of northwest China-taking Xining Botanical Garden as an example. Chinese Landscape Architecture, 2022, 38(S1): 86-90. |
| 陈静, 方路行, 朱程伟. 西北半干旱地区山地公园海绵城市建设实践——以西宁市植物园为例. 中国园林, 2022, 38(S1): 86-90. | |
| [55] | Li Z, Teng H F. Investigation on sponge city construction status in the semi-arid region of western China and research on sample model innovation——taking Xifeng District of Qingyang City as an example. Intelligent Building & Smart City, 2025(6): 17-22. |
| 李祯, 滕海峰. 西部半干旱区海绵城市建设现状调查及样本模式创新研究——以庆阳市西峰区为例. 智能建筑与智慧城市, 2025(6): 17-22. | |
| [56] | Yang Y, Wang Q, Sun C. A spatial layout of green-grey-blue facilities in semi-arid cities based on waterlogging prevention and control. Architecture & Culture, 2025(2): 245-249. |
| 阳烨, 王琦, 孙晨. 基于内涝防治的半干旱城市绿-灰-蓝设施空间分布研究. 建筑与文化, 2025(2): 245-249. | |
| [57] | Guasconi D, Cousins S, Manzoni S, et al. Spatial and temporal variability in soil and vegetation carbon dynamics under experimental drought and soil amendments. EGUsphere, 2023, 2023: 1-28. |
| [1] | Jing-jing MAI, Qi-sheng FENG, Rui-jing WANG, Sen-yao FENG, Zhe-ren JIN, Zhong-xue ZHANG, Tian-gang LIANG, Jia-ming JIN. Construction of a high-precision cultivated land identification model based on machine learning-using Zhangye City, Gansu Province as an example [J]. Acta Prataculturae Sinica, 2025, 34(2): 149-162. |
| [2] | Ya-ting XIAO, Yu-zhe TANG, Lu WANG, Yu-fei BAI, Hai-bo YANG, Fei LI. Use of spectral index-assisted machine learning to improve the accuracy of maize leaf water content estimation [J]. Acta Prataculturae Sinica, 2025, 34(12): 85-96. |
| [3] | Zhi-gui YANG, Jian-guo ZHANG, Jin-rong LI, Hong-yan YU, Li CHANG, Shu-hua YI, Yan-yan LYU, Yu-zhuo ZHANG, Bao-ping MENG. Spatiotemporal dynamic variation of temperate grassland classes in Inner Mongolia in the last 20 years [J]. Acta Prataculturae Sinica, 2023, 32(9): 1-16. |
| [4] | Rui GUO, Shuai FU, Meng-jing HOU, Jie LIU, Chun-li MIAO, Xin-yue MENG, Qi-sheng FENG, Jin-sheng HE, Da-wen QIAN, Tian-gang LIANG. Remote sensing retrieval of nature grassland biomass in Menyuan County, Qinghai Province experimental area based on Sentinel-2 data [J]. Acta Prataculturae Sinica, 2023, 32(4): 15-29. |
| [5] | Chun-li MIAO, Zhong-xian LI, Zhi-cheng ZHAO, Shuai FU, Jin-long GAO, Jie LIU, Qi-sheng FENG, Tian-gang LIANG. Real-time monitoring and analysis algorithm for key biophysical indicators of cultivated alfalfa in a grassland intelligent perception system [J]. Acta Prataculturae Sinica, 2023, 32(12): 90-103. |
| [6] | Fang-zhen LI, Hua-ping ZHONG, Ke-hui OUYANG, Xiao-min ZHAO, Yu-zhe LI. Estimation and digital mapping of grassland belowground biomass in the Altay region, China, based on machine learning [J]. Acta Prataculturae Sinica, 2022, 31(8): 13-23. |
| [7] | Ge-xia QIN, Jing WU, Chun-bin LI, Zhen-xia JI, Zheng-chao QIU, Ying LI. Inversion of grassland aboveground biomass in Tianzhu Zangzu Autonomous County based on a machine learning algorithm [J]. Acta Prataculturae Sinica, 2022, 31(4): 177-188. |
| [8] | Zhe-ren JIN, Qi-sheng FENG, Rui-jing WANG, Tian-gang LIANG. A study of grassland aboveground biomass on the Tibetan Plateau using MODIS data and machine learning [J]. Acta Prataculturae Sinica, 2022, 31(10): 1-17. |
| Viewed | ||||||
|
Full text |
|
|||||
|
Abstract |
|
|||||