
ISSN 1004-5759 CN 62-1105/S
Acta Prataculturae Sinica ›› 2024, Vol. 33 ›› Issue (2): 57-67.DOI: 10.11686/cyxb2023166
Previous Articles Next Articles
Jia-hui CHEN( ), Wen-xian LIU()
Received:2023-05-17
Revised:2023-07-05
Online:2024-02-20
Published:2023-12-12
Contact:
Wen-xian LIU
Jia-hui CHEN, Wen-xian LIU. Construction and application of a graphic visualization tool for important forage omics data[J]. Acta Prataculturae Sinica, 2024, 33(2): 57-67.

Fig.1 10 species reference maps for drawing SVG images
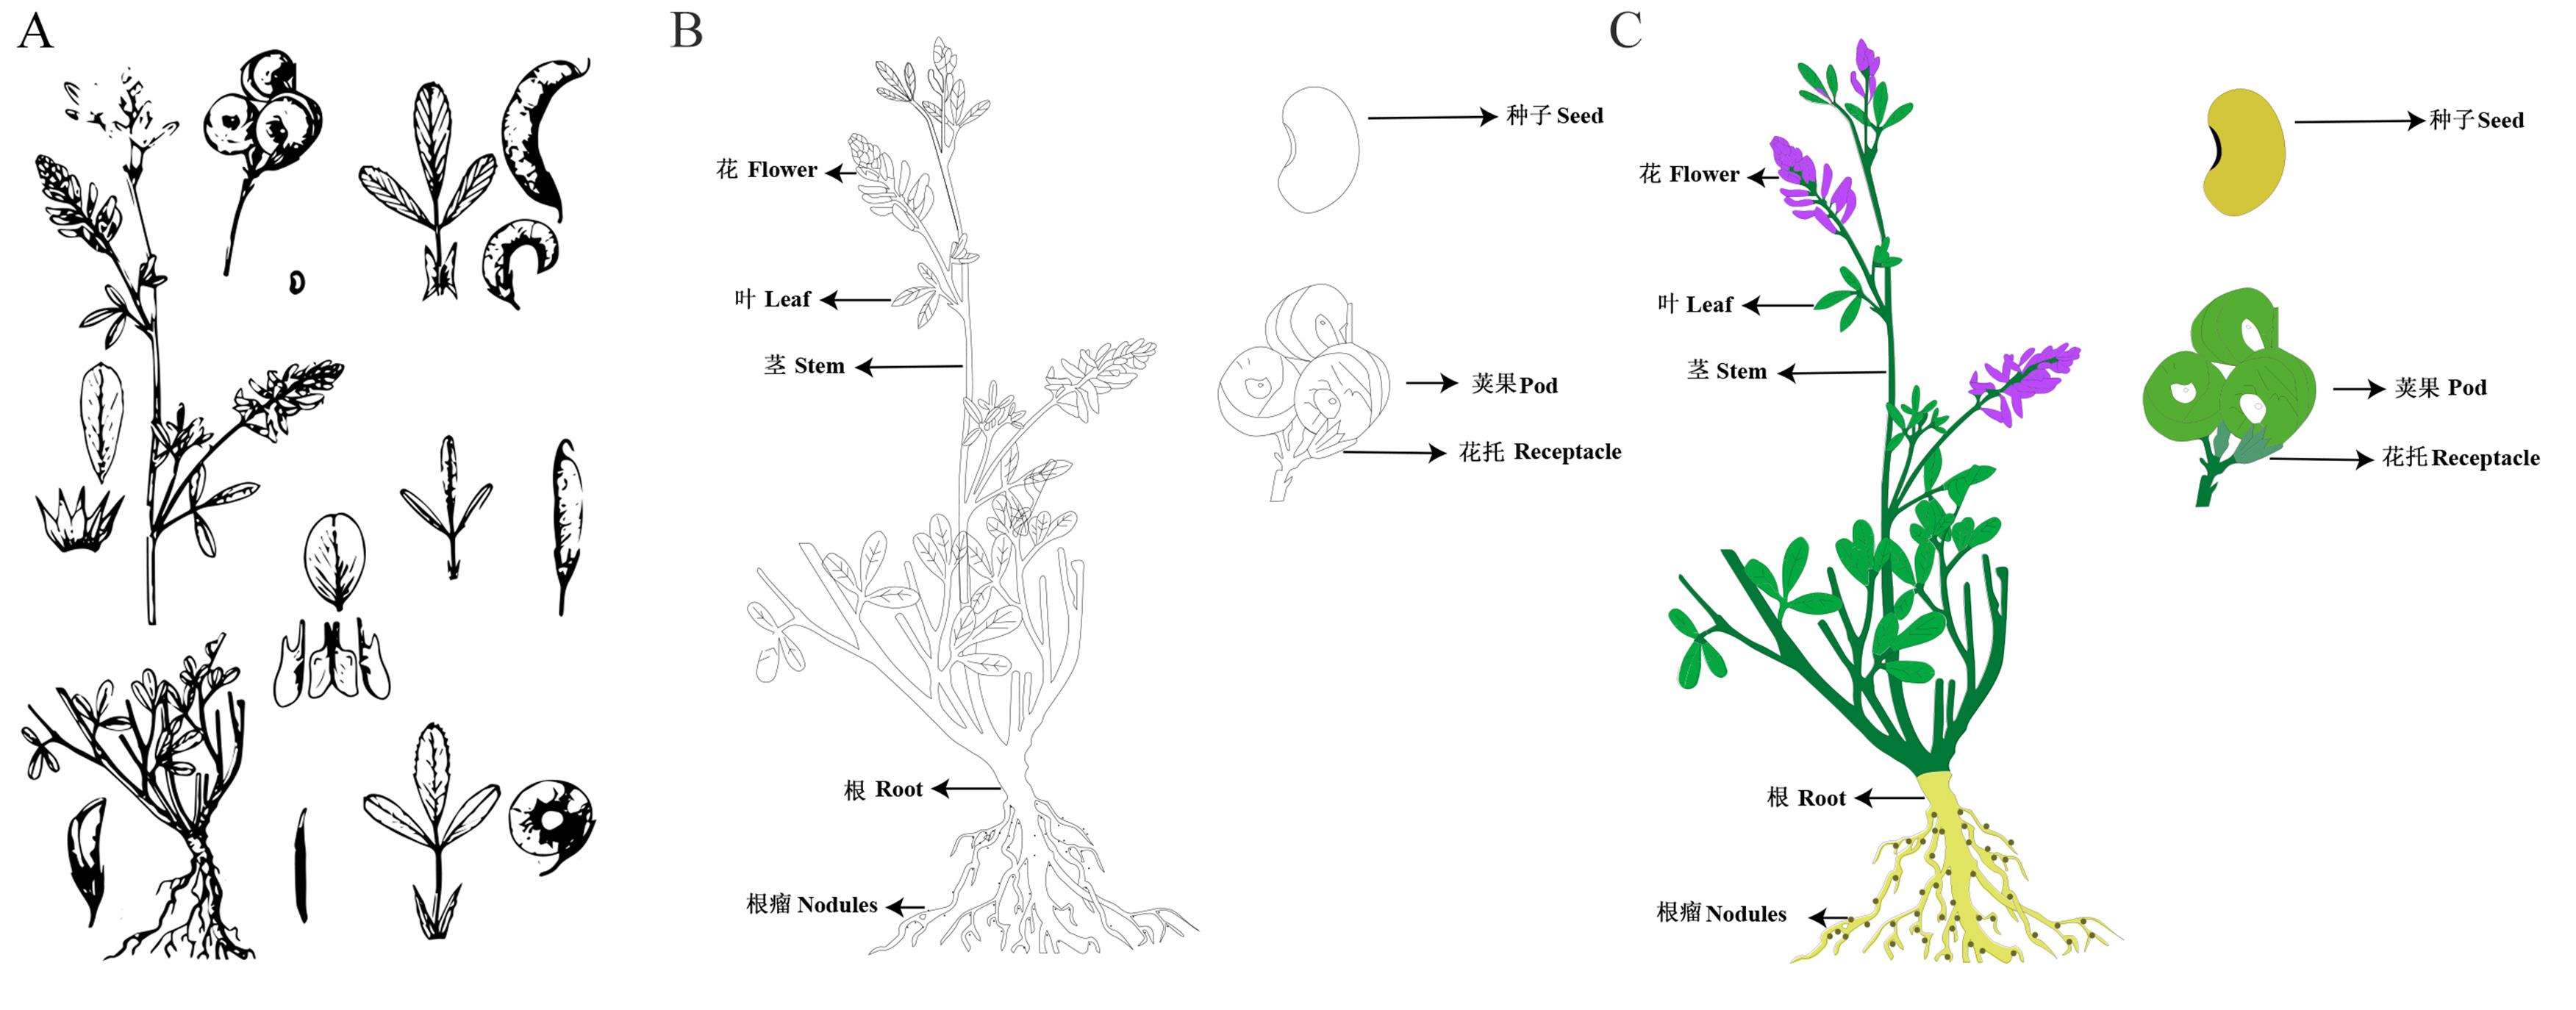
Fig.2 The process of drawing SVG diagram of alfalfa

Fig.3 Results of SVG image generation for ten forage grasses
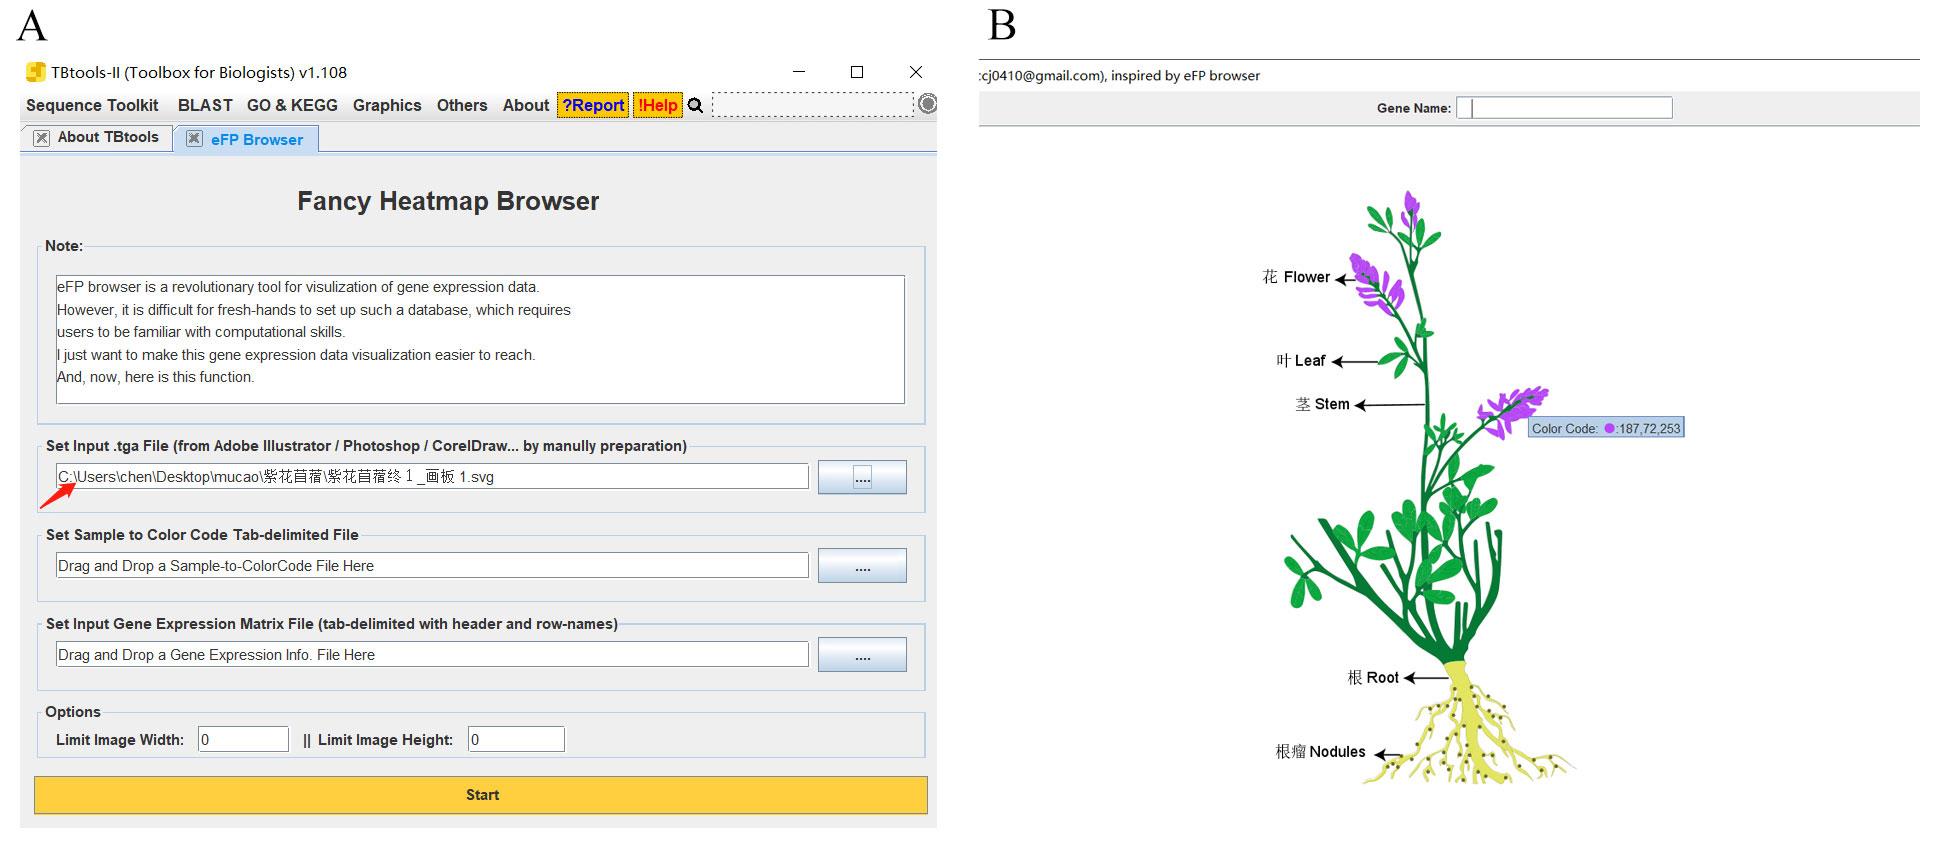
Fig.4 Acquisition of color code
| 器官Organ | 颜色代码Color code |
|---|---|
| 花Flower | 187,72,253 |
| 叶Leaf | 0,168,64 |
| 根瘤Nodule | 107,105,44 |
| 根Root | 225,228,98 |
Table 1 Color code for heatmap generation
| 器官Organ | 颜色代码Color code |
|---|---|
| 花Flower | 187,72,253 |
| 叶Leaf | 0,168,64 |
| 根瘤Nodule | 107,105,44 |
| 根Root | 225,228,98 |
基因名称 Gene ID | 花 Flower | 叶 Leaf | 根瘤 Nodule | 根 Root |
|---|---|---|---|---|
| MsSAP7/13 | 9 | 5 | 7 | 13 |
| MsSAP14 | 53 | 41 | 32 | 38 |
| MsSAP6/18 | 76 | 36 | 23 | 55 |
| MsSAP8/10/12 | 0 | 0 | 1 | 0 |
| MsSAP19/20 | 38 | 46 | 38 | 51 |
| MsSAP21/22 | 2 | 0 | 0 | 0 |
Table 2 Expression matrix of different tissues of alfalfa
基因名称 Gene ID | 花 Flower | 叶 Leaf | 根瘤 Nodule | 根 Root |
|---|---|---|---|---|
| MsSAP7/13 | 9 | 5 | 7 | 13 |
| MsSAP14 | 53 | 41 | 32 | 38 |
| MsSAP6/18 | 76 | 36 | 23 | 55 |
| MsSAP8/10/12 | 0 | 0 | 1 | 0 |
| MsSAP19/20 | 38 | 46 | 38 | 51 |
| MsSAP21/22 | 2 | 0 | 0 | 0 |

Fig.5 Interface of eFP Browers
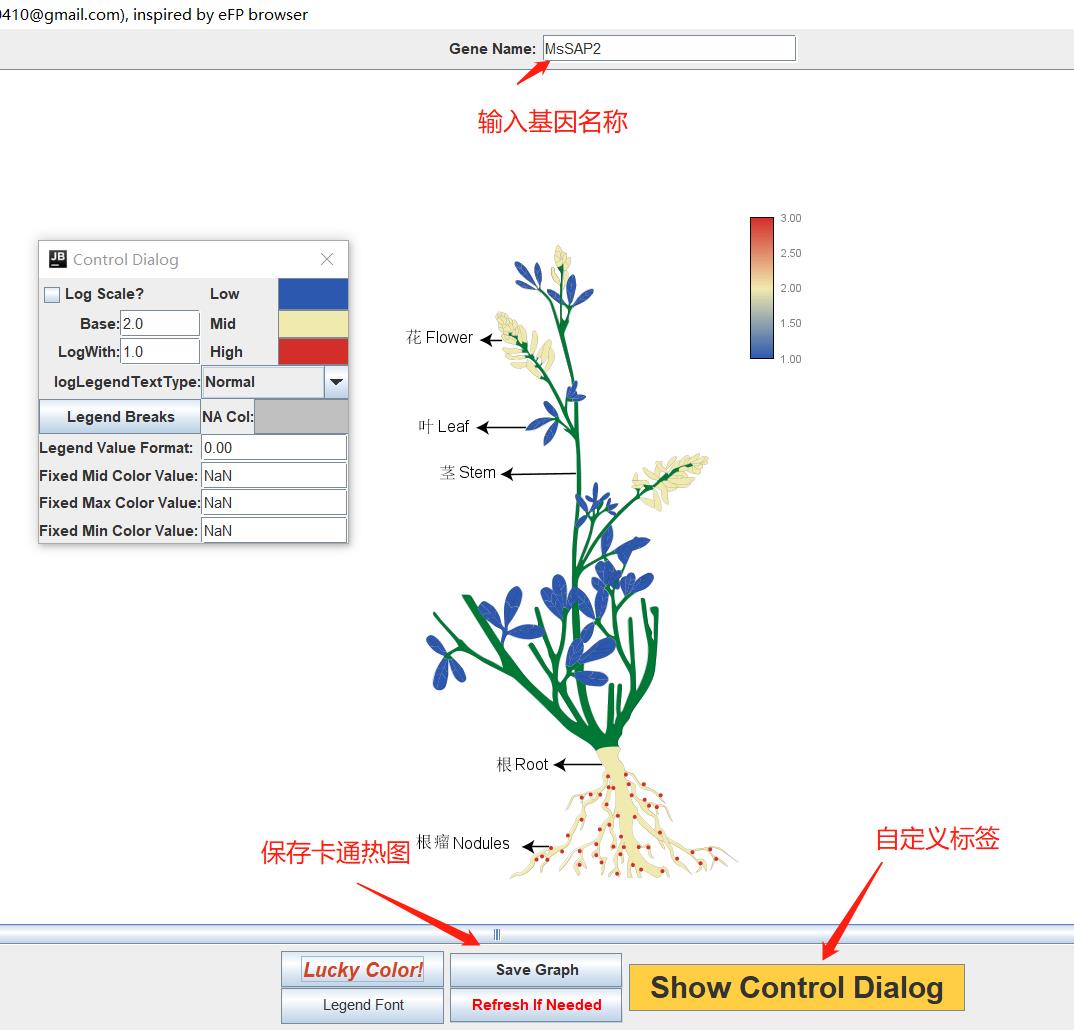
Fig.6 TBtools cartoon heatmap result output interface

Fig.7 Analysis of the tissue expression pattern of alfalfa SAP members

Fig.8 Gene expression in root systems treated with different durations of aluminum stress
| 1 | Guo T, Bai J, Wang J G. Research on the present situation and countermeasures of alfalfa grass industry in China. Chinese Journal of Grassland, 2018, 40(4): 111-115. |
| 郭婷, 白娟, 王建国. 刍议我国苜蓿草产业发展现状与对策. 中国草地学报, 2018, 40(4): 111-115. | |
| 2 | Jin J B, Wang T, Cheng Y F, et al. Current situation and prospect of forage breeding in China. Bulletin of Chinese Academy of Sciences, 2021, 36(6): 660-665. |
| 金京波, 王台, 程佑发, 等. 我国牧草育种现状与展望.中国科学院院刊, 2021, 36(6): 660-665. | |
| 3 | Liu Z P, Zhou Q, Liu W X, et al. Some scientific issues of forage breeding in China. Acta Prataculturae Sinica, 2021, 30(12): 184-193. |
| 刘志鹏, 周强, 刘文献, 等. 中国牧草育种中的若干科学问题. 草业学报, 2021, 30(12): 184-193. | |
| 4 | Zhang S, Wang C. Transcriptome profiling of gene expression in fall dormant and nondormant alfalfa. Genomics Data, 2014, 2: 282-284. |
| 5 | Wan L, Li Y, Li S, et al. Transcriptomic profiling revealed genes involved in response to drought stress in alfalfa. Journal of Plant Growth Regulation, 2022, 41(1): 92-112. |
| 6 | Zhao J Y. Genome sequencing and assemble analysis of Medicago sativa. Harbin: Harbin Normal University, 2019. |
| 赵金月. 紫花苜蓿基因组测序及分析. 哈尔滨: 哈尔滨师范大学, 2019. | |
| 7 | Song J, Mao H, Cheng J, et al. Identification of the trehalose-6-phosphate synthase gene family in Medicago truncatula and expression analysis under abiotic stresses. Gene, 2021, 787(575): 145641. |
| 8 | Branca A, Paape T D, Zhou P, et al. Whole-genome nucleotide diversity, recombination, and linkage disequilibrium in the model legume Medicago truncatula. Proceedings of the National Academy of Sciences, 2011, 108(42): e864-e870. |
| 9 | Wu F, Duan Z, Xu P, et al. Genome and systems biology of Melilotus albus provides insights into coumarins biosynthesis. Plant Biotechnology Journal, 2022, 20(3): 592-609. |
| 10 | Ma Q, Bao A K, Chai W W, et al. Transcriptomic analysis of the succulent xerophyte Zygophyllum xanthoxylum in response to salt treatment and osmotic stress. Plant and Soil, 2016, 402(1/2): 343-361. |
| 11 | Abeynayake S W, Byrne S, Nagy I, et al. Changes in Lolium perenne transcriptome during cold acclimation in two genotypes adapted to different climatic conditions. BMC Plant Biology, 2015, 15(1): 250. |
| 12 | Diekmann K, Hodkinson T R, Wolfe K H, et al. Complete chloroplast genome sequence of a major allogamous forage species, perennial ryegrass (Lolium perenne L.). DNA Research, 2009, 16(3): 165-176. |
| 13 | Li X, Liu S, Yuan G, et al. Comparative transcriptome analysis provides insights into the distinct germination in sheepgrass (Leymus chinensis) during seed development. Plant Physiology and Biochemistry, 2019, 139: 446-458. |
| 14 | Sun Y, Wang F, Wang N, et al. Transcriptome exploration in Leymus chinensis under saline-alkaline treatment using 454 pyrosequencing. PLoS One, 2013, 8(1): e53632. |
| 15 | Peng Y, Yan H, Guo L, et al. Reference genome assemblies reveal the origin and evolution of allohexaploid oat. Nature Genetics, 2022, 54(8): 1248-1258. |
| 16 | Ma L, Wang X, Yan M, et al. Genome survey sequencing of common vetch (Vicia sativa L.) and genetic diversity analysis of Chinese germplasm with genomic SSR markers. Molecular Biology Reports, 2022, 49(1): 313-320. |
| 17 | Patrick S S, Doreen W, Robert S F, et al. The b73 maize genome: Complexity, diversity, and dynamics. Science, 2009, 326(5956): 1112-1115. |
| 18 | Zhao Y Q. Screening of low seed-shattering germplasm and identification of candidate genes for seed shattering in Elymus nutans. Lanzhou: Lanzhou University, 2019. |
| 赵永强. 垂穗披碱草低落粒种质筛选及落粒候选基因挖掘. 兰州: 兰州大学, 2019. | |
| 19 | Liu R J, Lu X W, Dou Q W. Development of SSR markers in Elymus nutans based on reduced-representation genome sequencing. Molecular Plant Breeding, 2018, 16(6): 1888-1894. |
| 刘瑞娟, 路兴旺, 窦全文. 基于简化基因组测序开发垂穗披碱草(Elymus nutans)SSR标记. 分子植物育种, 2018, 16(6): 1888-1894. | |
| 20 | Winter D, Vinegar B, Nahal H, et al. An “Electronic Fluorescent Pictograph” browser for exploring and analyzing large-scale biological data sets. PLoS One, 2007, 2(8): e718. |
| 21 | Hawkins C, Caruana J, Li J, et al. An eFP browser for visualizing strawberry fruit and flower transcriptomes. Horticulture Research, 2017, 4(1): 17029. |
| 22 | Sateesh K, John N, Yogendra K, et al. The developmental transcriptome atlas of the biofuel crop Camelina sativa. The Plant Journal: for Cell and Molecular Biology, 2016, 88(5): 879-894. |
| 23 | Waese J, Fan J, Pasha A, et al. ePlant: Visualizing and exploring multiple levels of data for hypothesis generation in plant biology. Plant Cell, 2017, 29(8): 1806-1821. |
| 24 | Mao Q, Chen C J, Xie T, et al. Comprehensive tissue-specific transcriptome profiling of pineapple (Ananas comosus) and building an eFP-browser for further study. PeerJ, 2018, 6: e6028. |
| 25 | Brian L, Warren B, Mcatee P, et al. A gene expression atlas for kiwifruit (Actinidia chinensis) and network analysis of transcription factors. BMC Plant Biology, 2021, 21(1): 121. |
| 26 | Wang Q X. Functional analysis of alfalfa SAP22 gene in response to drought stress. Lanzhou: Lanzhou University, 2022. |
| 王秋霞. 紫花苜蓿SAP22基因响应干旱胁迫功能分析. 兰州: 兰州大学, 2022. | |
| 27 | Yang Y C. Analysis of SVG format image file and its application in construction of public library website. Computer Era, 2021(11): 34-37. |
| 杨义臣. 浅析SVG格式图像文件及其在公共图书馆网站建设中的应用. 计算机时代, 2021(11): 34-37. | |
| 28 | Shi S P, Zhang Y M, Yang S L, et al. Construction of electronic map display module of ocean liner based on SVG format. Marine Technology, 2022, 50(4): 48-52. |
| 石粟萍, 张怡敏, 杨山林, 等. 基于SVG格式的远洋客船电子地图显示模块构建. 造船技术, 2022, 50(4): 48-52. | |
| 29 | Jing H C, Wang T, Lin R C, et al. Strengthen the research of forage basic biology to ensure forage seed industry and national food security. Bulletin of Botany, 2022, 57(6): 719-724. |
| 景海春, 王台, 林荣呈, 等. 加强饲草基础生物学研究, 保障饲草种业与国家大粮食安全. 植物学报, 2022, 57(6): 719-724. | |
| 30 | Fang Y H, Nan W B, Liang Y S, et al. Plant tissue-specific gene expression system and its application. Plant Physiology Journal, 2015, 51(6): 797-805. |
| 方彦昊, 南文斌, 梁永书, 等. 植物组织特异性基因表达技术及其应用. 植物生理学报, 2015, 51(6): 797-805. | |
| 31 | Pattison R J, Csukasi F, Zheng Y, et al. Comprehensive tissue-specific transcriptome analysis reveals distinct regulatory programs during early tomato fruit development. Plant Physiology, 2015, 168(4): 1684-1701. |
| 32 | Chowdhury S, Mukherjee A, Basak S, et al. Disruption of tomato TGS machinery by ToLCNDV causes reprogramming of vascular tissue-specific TORNADO1 gene expression. Planta, 2022, 256(4): 78. |
| 33 | Yu T T, Xu A F, Zhang J L, et al. Gene identification and organ expression characteristics of SHR subfamily in Malus domestica. Journal of Shandong Agricultural University (Natural Science Edition), 2022, 53(3): 346-354. |
| 于婷婷, 许阿飞, 张佳林, 等. 苹果SHR亚家族基因特征及其器官表达谱分析. 山东农业大学学报(自然科学版), 2022, 53(3): 346-354. |
| [1] | Jin GUAN, Yi-di GUO, Ling-yun LIU, Shu-xia YIN, Ke TENG. An efficient protocol for Zoysia japonica mesophyll protoplast isolation and transformation, and its application in subcellular localization and protein interaction analysis [J]. Acta Prataculturae Sinica, 2023, 32(7): 61-71. |
| [2] | Xue-ling YE, Zhen GAN, Yan WAN, Da-bing XIANG, Xiao-yong WU, Qi WU, Chang-ying LIU, Yu FAN, Liang ZOU. Advances and perspectives in forage oat breeding [J]. Acta Prataculturae Sinica, 2023, 32(2): 160-177. |
| [3] | Mu-ye LIU, Li-zhu GUO, Yue-sen YUE, Ju-ying WU, Xi-feng FAN, Guo-zeng XIAO, Ke TENG. Physiological and antioxidant enzyme gene expression differences between female and male Buchloe dactyloides plants under drought stress [J]. Acta Prataculturae Sinica, 2023, 32(10): 93-103. |
| [4] | Hao-yu XU, Ying ZHAO, Qian RUAN, Xiao-lin ZHU, Bao-qiang WANG, Xiao-hong WEI. Resistance of quinoa seedlings under different salt-alkali stress levels [J]. Acta Prataculturae Sinica, 2023, 32(1): 122-130. |
| [5] | Ling-shuang ZENG, Pei-ying LI, Zong-jiu SUN, Xiao-fan SUN. Analysis of antioxidant enzyme protection systems and gene expression differences in two Xinjiang bermudagrass genotypes with contrasting drought resistance [J]. Acta Prataculturae Sinica, 2022, 31(7): 122-132. |
| [6] | Li-juan GAO, Zheng-she ZHANG, Yu WEN, Xi-fang ZONG, Qi YAN, Li-yan LU, Xian-feng YI, Ji-yu ZHANG. Genome-wide identification and expression analysis of the bHLH transcription factor family in Cenchrus purpureus [J]. Acta Prataculturae Sinica, 2022, 31(3): 47-59. |
| [7] | Li-qing ZHAO, Zhi-gang HAO, Xiao-yan CUI, Xiang-yong PENG. Effects of gibberellin and its inhibitors on growth and gene expression in Poa pratensis [J]. Acta Prataculturae Sinica, 2022, 31(3): 85-91. |
| [8] | Guo-xiang ZHANG, Wei-leng GUO, Ming-yu BI, Li-shuang ZHANG, Dan WANG, Chang-hong GUO. Identification of CAX gene family and expression profile analysis of response to abiotic stress in alfalfa [J]. Acta Prataculturae Sinica, 2022, 31(12): 106-117. |
| [9] | Ning ZHAO, Hui-ling MA, Ran ZHANG, Jin-qing ZHANG, Yi SHI. Regulatory effects of butanediol on the expression level of endogenous hormones and related genes in creeping bentgrass under heat stress [J]. Acta Prataculturae Sinica, 2022, 31(12): 118-132. |
| [10] | Na WEI, Yan-peng LI, Yi-tong MA, Wen-xian LIU. Genome-wide identification of the alfalfa TCP gene family and analysis of gene transcription patterns in alfalfa (Medicago sativa) under drought stress [J]. Acta Prataculturae Sinica, 2022, 31(1): 118-130. |
| [11] | Zhi-peng LIU, Qiang ZHOU, Wen-xian LIU, Ji-yu ZHANG, Wen-gang XIE, Long-fa FANG, Yan-rong WANG, Zhi-biao NAN. Some scientific issues of forage breeding in China [J]. Acta Prataculturae Sinica, 2021, 30(12): 184-193. |
| [12] | Qian MA, Qi YAN, Zheng-she ZHANG, Fan WU, Ji-yu ZHANG. Identification, evolution and expression analysis of the CCoAOMT family genes in Medicago sativa [J]. Acta Prataculturae Sinica, 2021, 30(11): 144-156. |
| [13] | ZHANG Yu-tong, SHI Feng-ling. Research progress on plant architecture formation and forage grass plant architecture [J]. Acta Prataculturae Sinica, 2020, 29(9): 203-214. |
| [14] | ZHAO Yuan-yuan, LIU Zi-yang, BIAN Jia-hui, SUN Zhan-min, ZHOU Tao, TANG Yi-xiong, WU Yan-min. Research advances in epigenetics of forage grasses [J]. Acta Prataculturae Sinica, 2020, 29(4): 168-183. |
| [15] | XU Liu-xing, TANG Guo-jian, HU Ya-qin, ZHANG Jian-guo. Research status and development prospects for forage wheat production and utilization [J]. Acta Prataculturae Sinica, 2020, 29(10): 192-199. |
| Viewed | ||||||
|
Full text |
|
|||||
|
Abstract |
|
|||||