

ISSN 1004-5759 CN 62-1105/S
草业学报 ›› 2024, Vol. 33 ›› Issue (4): 73-86.DOI: 10.11686/cyxb2023183
慕平1( ), 柴继宽2, 苏玮娟2, 章海龙3, 赵桂琴2()
收稿日期:2023-05-31
修回日期:2023-09-15
出版日期:2024-04-20
发布日期:2024-01-15
通讯作者:
赵桂琴
作者简介:E-mail: zhaogq@gsau.edu基金资助:
Ping MU1(), Ji-kuan CHAI2, Wei-juan SU2, Hai-long ZHANG3, Gui-qin ZHAO2()
Received:2023-05-31
Revised:2023-09-15
Online:2024-04-20
Published:2024-01-15
Contact:
Gui-qin ZHAO
摘要:
为了明确燕麦不同组合正、反交杂种后代的表型差异及遗传变异情况,本研究以福瑞至(F709)与709(709F)、牧乐思(ML2)与陇燕2号(L2M)为亲本配制正、反交组合,用简单序列重复分子标记对杂种F1代进行了鉴定,比较了正、反交杂种的表型差异,并分析了杂种F2代的遗传变异及多样性。结果表明:用SSR分子标记从37个F1单株中共鉴定出32个真杂种,占比86.5%。福瑞至和709、牧乐思和陇燕2号组合的F1真杂种率分别为88.9%和84.2%。正、反交对杂种后代的表型有显著影响。F709-F1的旗叶比反交的窄19.4%;ML2-F1的主穗粒数比反交少12.2%。F2群体遗传变异幅度较大。同一性状在正、反交F2中的遗传变异系数(Gcv)、广义遗传力(Hb)和相对遗传进度(ΔGt)存在显著差异。F2群体株高的遗传变异系数较小(4.50%~10.27%)、广义遗传力较高(33.12%~85.41%),分蘖数和有效分蘖数的相对遗传进度较大。福瑞至和709的正、反交F2群体的穗下节长的广义遗传力是所有指标中最低的,分别为14.13%和23.81%,相对遗传进度也最小。主穗粒数的Gcv在其正、反交F2中的差异最显著,在F709-F2中为7.09%,反交中增至19.03%;F709-F2的Hb为22.54%,反交则为66.01%。牧乐思和陇燕2号的正、反交F2群体叶片数的广义遗传力最高(99.53%),几乎不受环境的影响。ML2-F2旗叶宽的Hb为9.07%,其ΔGt为2.79,反交中旗叶宽的Hb为30.23%,ΔGt为9.77。10对SSR引物对F2群体扩增的多态性比率达73.5%,实际杂合度为0.35~0.99,远高于期望杂合度;Nei’s基因多态性、香农指数分别为0.29~0.50和0.53~0.71,F2群体分离现象明显,遗传变异幅度大,具有较大的选择空间。
慕平, 柴继宽, 苏玮娟, 章海龙, 赵桂琴. 燕麦不同组合正、反交杂种后代的表型及遗传参数分析[J]. 草业学报, 2024, 33(4): 73-86.
Ping MU, Ji-kuan CHAI, Wei-juan SU, Hai-long ZHANG, Gui-qin ZHAO. Phenotype and genetic variation analysis of forward and reverse hybrid progeny from different oat crosses[J]. Acta Prataculturae Sinica, 2024, 33(4): 73-86.
亲本 Parent | 组合Combination (♀×♂) | 代号 Number |
|---|---|---|
| 福瑞至Forage | F: 福瑞至Forage×709 | F709 |
| 709 | R: 709×福瑞至Forage | 709F |
| 牧乐思Molass (M) | F: M×L | ML2 |
| 陇燕2号Longyan No.2 (L) | R: L×M | L2M |
表1 亲本组配
Table 1 Parent combination
亲本 Parent | 组合Combination (♀×♂) | 代号 Number |
|---|---|---|
| 福瑞至Forage | F: 福瑞至Forage×709 | F709 |
| 709 | R: 709×福瑞至Forage | 709F |
| 牧乐思Molass (M) | F: M×L | ML2 |
| 陇燕2号Longyan No.2 (L) | R: L×M | L2M |
| 引物Primer | 正向引物Forward primer (5'-3') | 反向引物Reverse primer (5'-3') | 退火温度Annealing temperature (℃) |
|---|---|---|---|
| P15 | GAGCATGCTCTGGATGGAAA | CCCGTTTATGTGATTGTTAGC | 54.5 |
| MAMA_2 | TTCCCACTCCGTGTTCTCTC | GATGGACGCACAAGAATCG | 55.0 |
| P12 | TCGCCATTAATAAGAGCGAAGG | GCTGCTGTTGCGTGGTTAGTG | 56.0 |
| AM54 | AAACCCGTGCAAGAAACCAA | TGCGGGAGGAGGGAAGAC | 56.0 |
| P22 | CTGGTCATCGTCGCCGTTCA | CATTTAGCCAGGATGCCAGGTC | 57.0 |
| AM89 | GGCGGTTGGAGAGTGTCTT | AGGTGAAGGCGAGTGGAAG | 57.5 |
| AM31 | GCAAAGGCCATATGGTGAGAA | CATAGGTTTGCCATTCGTGGT | 55.0 |
| P38 | AGAGCAATTACCAGTCCAATG | GTCGTAGGAGAAGCGGCCCTG | 56.0 |
| P35 | TGCTCAGCAAGCATCACAAT | TGTGCATACATCTGTGCTTA | 53.0 |
| AM1789 | CTTCTGCACATGAAACCCTA | AGTCAGCACATGCACCCTC | 55.0 |
表2 10对引物基本信息
Table 2 Basic information of 10 pairs of primers
| 引物Primer | 正向引物Forward primer (5'-3') | 反向引物Reverse primer (5'-3') | 退火温度Annealing temperature (℃) |
|---|---|---|---|
| P15 | GAGCATGCTCTGGATGGAAA | CCCGTTTATGTGATTGTTAGC | 54.5 |
| MAMA_2 | TTCCCACTCCGTGTTCTCTC | GATGGACGCACAAGAATCG | 55.0 |
| P12 | TCGCCATTAATAAGAGCGAAGG | GCTGCTGTTGCGTGGTTAGTG | 56.0 |
| AM54 | AAACCCGTGCAAGAAACCAA | TGCGGGAGGAGGGAAGAC | 56.0 |
| P22 | CTGGTCATCGTCGCCGTTCA | CATTTAGCCAGGATGCCAGGTC | 57.0 |
| AM89 | GGCGGTTGGAGAGTGTCTT | AGGTGAAGGCGAGTGGAAG | 57.5 |
| AM31 | GCAAAGGCCATATGGTGAGAA | CATAGGTTTGCCATTCGTGGT | 55.0 |
| P38 | AGAGCAATTACCAGTCCAATG | GTCGTAGGAGAAGCGGCCCTG | 56.0 |
| P35 | TGCTCAGCAAGCATCACAAT | TGTGCATACATCTGTGCTTA | 53.0 |
| AM1789 | CTTCTGCACATGAAACCCTA | AGTCAGCACATGCACCCTC | 55.0 |
组分 Component | 所需量Required quantity (μL) |
|---|---|
| 2×San Taq PCR Mix (含蓝染液 Include blue dye) | 25.0 |
| DNA模板DNA template | 2.0 |
| 上游引物Upstream primer (10 μmol·L-1) | 2.0 |
| 下游引物Downstream primer (10 μmol·L-1) | 2.0 |
| 灭菌双蒸水Sterilized ddH2O | 补足至Add to 50.0 |
表3 PCR反应体系
Table 3 PCR reaction system
组分 Component | 所需量Required quantity (μL) |
|---|---|
| 2×San Taq PCR Mix (含蓝染液 Include blue dye) | 25.0 |
| DNA模板DNA template | 2.0 |
| 上游引物Upstream primer (10 μmol·L-1) | 2.0 |
| 下游引物Downstream primer (10 μmol·L-1) | 2.0 |
| 灭菌双蒸水Sterilized ddH2O | 补足至Add to 50.0 |
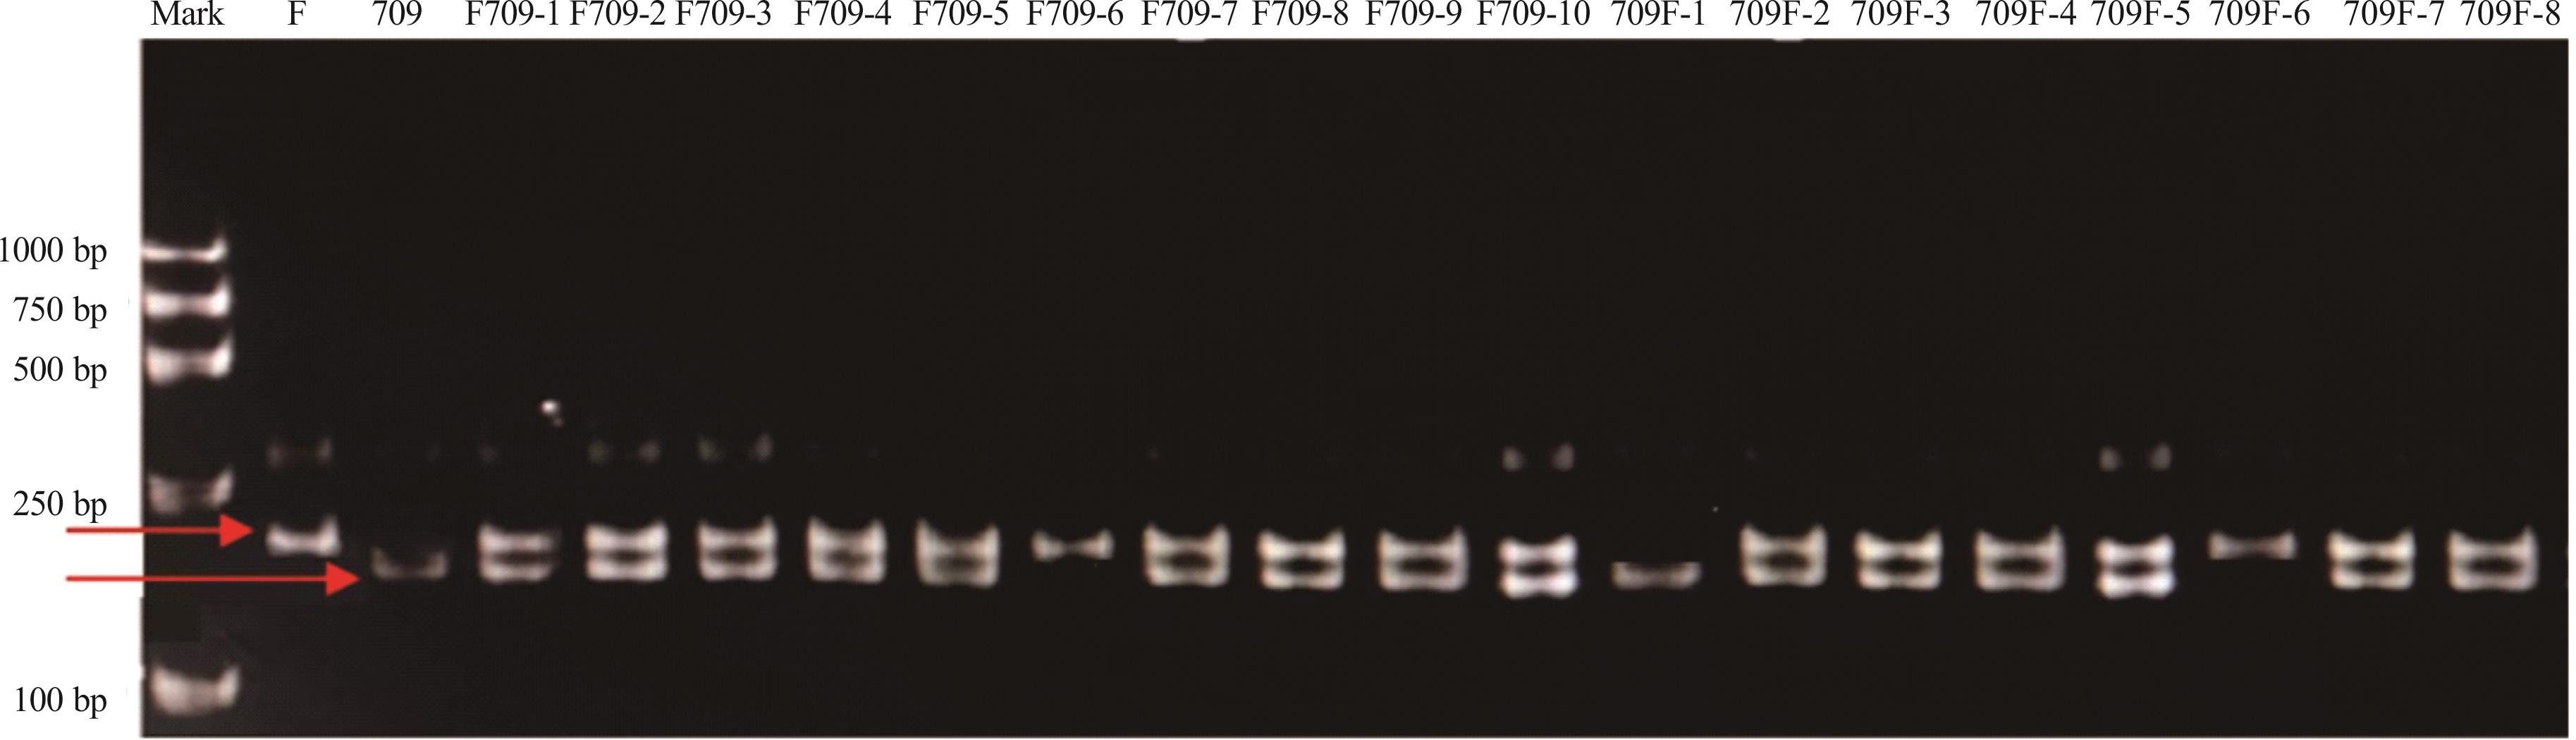
图1 引物MAMA—2对F709-F1和709F-F1的SSR扩增Mark: DNA分子量标准DNA marker; F: 福瑞至Forage; F、709: 双亲,箭头所指的为双亲的特征带Parents, the arrow refers to the characteristic band of parents; 下同the same below.
Fig.1 SSR amplification of F709-F1 and 709F-F1 with primer MAMA—2

图2 引物AM1789对ML2-F1和L2M-F1的SSR扩增M: 牧乐思Molass; L2: 陇燕2号Longyan No.2; M、L2: 双亲,箭头所指的为双亲的特征带Parents, the arrow refers to the characteristic band of parents; 下同the same below.
Fig.2 SSR amplification of ML2-F1 and L2M-F1 with primer AM1789
| F1株数Number of F1 plants | 单株编号Single plant code |
|---|---|
| 10 | F709-1、F709-2、F709-3、F709-4、F709-5、F709-6、F709-7、F709-8、F709-9、F709-10 |
| 8 | 709F-1、709F-2、709F-3、709F-4、709F-5、709F-6、709F-7、709F-8 |
| 10 | ML2-1、ML2-2、ML2-3、ML2-4、ML2-5、ML2-6、ML2-7、ML2-8、ML2-9、ML2-10 |
| 9 | L2M-1、L2M-2、L2M-3、L2M-4、L2M-5、L2M-6、L2M-7、L2M-8、L2M-9 |
表4 F1株数及编号
Table 4 Code and number of F1 plants
| F1株数Number of F1 plants | 单株编号Single plant code |
|---|---|
| 10 | F709-1、F709-2、F709-3、F709-4、F709-5、F709-6、F709-7、F709-8、F709-9、F709-10 |
| 8 | 709F-1、709F-2、709F-3、709F-4、709F-5、709F-6、709F-7、709F-8 |
| 10 | ML2-1、ML2-2、ML2-3、ML2-4、ML2-5、ML2-6、ML2-7、ML2-8、ML2-9、ML2-10 |
| 9 | L2M-1、L2M-2、L2M-3、L2M-4、L2M-5、L2M-6、L2M-7、L2M-8、L2M-9 |
亲本及杂交 后代 Parents and hybrid | 分蘖数 TN (No.) | 有效分蘖数 ETN (No.) | 株高 PH (cm) | 茎粗SD(mm) | 旗叶长FLL(cm) | 旗叶宽FLW(cm) | 倒二 叶长ISLL(cm) | 倒二叶宽ISLW(cm) | 叶片数LN(No.) | 主穗长MPL(cm) | 主穗 粒数GNMP(No.) | 千粒重TKW(g) | 轮层数 RL(No.) | 穗下 节长 PL (cm) |
|---|---|---|---|---|---|---|---|---|---|---|---|---|---|---|
| F709-F1 | 4.0±1.02a | 3.0±0.19a | 143.5±0.60b | 5.1±0.70b | 28.0±4.24a | 2.9±0.35bc | 43.9±2.27a | 3.0±0.18a | 6.0±0.33a | 33.9±1.25a | 187±6.08a | 22.6±4.33b | 6.0±1.00a | 35.7±2.85a |
| 709F-F1 | 3.0±1.00b | 2.0±0.54b | 121.6±2.75c | 4.0±0.39c | 26.0±0.40ab | 3.6±0.35a | 43.0±0.90a | 3.2±0.15a | 5.0±0.17b | 29.7±1.75b | 192±4.58a | 23.9±0.95b | 5.0±0.09b | 30.8±0.96b |
| 福瑞至Forage | 4.0±0.18a | 3.0±1.00a | 121.3±2.17c | 5.9±0.89a | 25.6±2.18b | 3.2±0.19ab | 38.4±1.89b | 2.7±0.15b | 6.0±0.77a | 24.0±3.47c | 186±4.36a | 27.5±1.61a | 5.0±0.18b | 25.7±0.85c |
| 709 | 3.0±0.34b | 3.0±0.26a | 152.1±3.04a | 4.3±0.27c | 25.9±2.39b | 2.5±0.15c | 43.7±1.47a | 2.6±0.18b | 5.0±0.63b | 33.8±0.42a | 157±3.00b | 26.4±0.66ab | 6.0±0.27a | 37.2±1.23a |
| ML2-F1 | 3.0±1.00b | 2.0±0.13b | 125.8±0.61d | 4.2±0.12ab | 25.7±1.68ab | 2.4±0.14ab | 40.6±0.71a | 2.7±0.13a | 6.0±0.23a | 24.3±0.90b | 172±7.21b | 22.9±0.62b | 5.0±0.35b | 34.2±0.46a |
| L2M-F1 | 4.0±0.13a | 4.0±1.09a | 129.7±1.14c | 3.9±0.20c | 28.2±1.44a | 2.6±0.10a | 41.4±2.25a | 2.7±0.26a | 5.0±0.19b | 25.5±0.98b | 196±3.00a | 25.5±0.87a | 6.0±0.67a | 33.7±1.05a |
| 牧乐思Molass | 4.0±0.12a | 4.0±0.08a | 138.7±2.36a | 4.4±0.16a | 23.2±0.85c | 2.2±0.18b | 39.7±2.33ab | 2.3±0.15b | 6.0±0.62a | 26.0±2.39b | 144±5.57c | 21.8±0.26bc | 6.0±0.35a | 33.5±0.62ab |
陇燕2号 Longyan No.2 | 3.0±0.11b | 2.0±0.67b | 131.8±0.85b | 4.0±0.13bc | 23.9±1.06c | 2.6±0.07a | 42.8±1.45a | 2.7±0.20a | 6.0±1.01a | 31.6±1.28a | 137±4.36c | 21.3±0.78c | 5.0±0.56b | 32.1±0.85b |
表5 亲本及其正、反交F1代的主要性状表现
Table 5 The main traits of parents and their F1 generations from forward and reverse cross
亲本及杂交 后代 Parents and hybrid | 分蘖数 TN (No.) | 有效分蘖数 ETN (No.) | 株高 PH (cm) | 茎粗SD(mm) | 旗叶长FLL(cm) | 旗叶宽FLW(cm) | 倒二 叶长ISLL(cm) | 倒二叶宽ISLW(cm) | 叶片数LN(No.) | 主穗长MPL(cm) | 主穗 粒数GNMP(No.) | 千粒重TKW(g) | 轮层数 RL(No.) | 穗下 节长 PL (cm) |
|---|---|---|---|---|---|---|---|---|---|---|---|---|---|---|
| F709-F1 | 4.0±1.02a | 3.0±0.19a | 143.5±0.60b | 5.1±0.70b | 28.0±4.24a | 2.9±0.35bc | 43.9±2.27a | 3.0±0.18a | 6.0±0.33a | 33.9±1.25a | 187±6.08a | 22.6±4.33b | 6.0±1.00a | 35.7±2.85a |
| 709F-F1 | 3.0±1.00b | 2.0±0.54b | 121.6±2.75c | 4.0±0.39c | 26.0±0.40ab | 3.6±0.35a | 43.0±0.90a | 3.2±0.15a | 5.0±0.17b | 29.7±1.75b | 192±4.58a | 23.9±0.95b | 5.0±0.09b | 30.8±0.96b |
| 福瑞至Forage | 4.0±0.18a | 3.0±1.00a | 121.3±2.17c | 5.9±0.89a | 25.6±2.18b | 3.2±0.19ab | 38.4±1.89b | 2.7±0.15b | 6.0±0.77a | 24.0±3.47c | 186±4.36a | 27.5±1.61a | 5.0±0.18b | 25.7±0.85c |
| 709 | 3.0±0.34b | 3.0±0.26a | 152.1±3.04a | 4.3±0.27c | 25.9±2.39b | 2.5±0.15c | 43.7±1.47a | 2.6±0.18b | 5.0±0.63b | 33.8±0.42a | 157±3.00b | 26.4±0.66ab | 6.0±0.27a | 37.2±1.23a |
| ML2-F1 | 3.0±1.00b | 2.0±0.13b | 125.8±0.61d | 4.2±0.12ab | 25.7±1.68ab | 2.4±0.14ab | 40.6±0.71a | 2.7±0.13a | 6.0±0.23a | 24.3±0.90b | 172±7.21b | 22.9±0.62b | 5.0±0.35b | 34.2±0.46a |
| L2M-F1 | 4.0±0.13a | 4.0±1.09a | 129.7±1.14c | 3.9±0.20c | 28.2±1.44a | 2.6±0.10a | 41.4±2.25a | 2.7±0.26a | 5.0±0.19b | 25.5±0.98b | 196±3.00a | 25.5±0.87a | 6.0±0.67a | 33.7±1.05a |
| 牧乐思Molass | 4.0±0.12a | 4.0±0.08a | 138.7±2.36a | 4.4±0.16a | 23.2±0.85c | 2.2±0.18b | 39.7±2.33ab | 2.3±0.15b | 6.0±0.62a | 26.0±2.39b | 144±5.57c | 21.8±0.26bc | 6.0±0.35a | 33.5±0.62ab |
陇燕2号 Longyan No.2 | 3.0±0.11b | 2.0±0.67b | 131.8±0.85b | 4.0±0.13bc | 23.9±1.06c | 2.6±0.07a | 42.8±1.45a | 2.7±0.20a | 6.0±1.01a | 31.6±1.28a | 137±4.36c | 21.3±0.78c | 5.0±0.56b | 32.1±0.85b |
组合 Combination | 遗传参数 Genetic parameter | 分蘖数 TN | 有效分蘖数ETN | 株高 PH | 茎粗 SD | 旗叶长 FLL | 旗叶宽 FLW | 倒二叶长 ISLL | 倒二叶宽 ISLW | 叶片数 LN | 主穗长 MPL | 主穗 粒数 GNMP | 千粒重 TKW | 轮层数 RL | 穗下节长 PL |
|---|---|---|---|---|---|---|---|---|---|---|---|---|---|---|---|
| F709-F2 | Gcv (%) | 33.62 | 37.85 | 5.32 | 18.50 | 20.68 | 14.01 | 10.94 | 18.34 | 11.40 | 13.81 | 7.09 | 5.97 | 9.87 | 5.33 |
| Hb (%) | 66.26 | 67.71 | 64.37 | 64.66 | 74.22 | 70.10 | 62.97 | 71.20 | 66.02 | 50.90 | 22.54 | 20.80 | 65.86 | 14.13 | |
| ΔGt | 56.38 | 63.99 | 8.97 | 30.65 | 36.70 | 24.17 | 17.88 | 31.87 | 19.08 | 20.30 | 6.93 | 5.61 | 16.51 | 4.08 | |
| Gv | 0.71 | 0.76 | 44.64 | 0.64 | 16.62 | 0.08 | 17.36 | 0.17 | 0.43 | 10.48 | 138.33 | 1.85 | 0.27 | 3.34 | |
| 709F-F2 | Gcv (%) | 31.28 | 34.41 | 10.27 | 18.98 | 18.89 | 14.60 | 12.43 | 11.85 | 8.66 | 19.35 | 19.03 | 6.95 | 11.55 | 8.30 |
| Hb (%) | 61.22 | 66.21 | 85.41 | 69.76 | 69.27 | 76.93 | 63.74 | 52.87 | 50.94 | 63.04 | 66.01 | 45.59 | 72.93 | 23.81 | |
| ΔGt | 50.41 | 57.68 | 19.55 | 32.65 | 32.39 | 26.38 | 20.44 | 17.75 | 12.73 | 31.65 | 31.86 | 9.67 | 20.31 | 8.35 | |
| Gv | 0.57 | 0.71 | 144.65 | 0.81 | 13.01 | 0.11 | 17.94 | 0.08 | 0.23 | 17.25 | 923.04 | 2.76 | 0.37 | 6.34 | |
| ML2-F2 | Gcv (%) | 33.71 | 30.38 | 5.25 | 10.69 | 13.71 | 4.49 | 7.83 | 10.27 | 11.54 | 12.20 | 2.45 | 8.52 | 5.91 | 10.86 |
| Hb (%) | 69.13 | 60.86 | 39.47 | 28.37 | 50.12 | 9.07 | 33.99 | 53.16 | 99.53 | 62.54 | 1.81 | 29.80 | 23.84 | 50.73 | |
| ΔGt | 57.74 | 48.82 | 6.79 | 11.73 | 19.99 | 2.79 | 9.40 | 15.43 | 23.78 | 19.88 | 0.68 | 9.58 | 5.95 | 15.93 | |
| Gv | 0.66 | 0.53 | 42.30 | 0.20 | 5.67 | 0.01 | 6.74 | 0.05 | 0.41 | 6.44 | 14.58 | 3.97 | 0.08 | 14.67 | |
| L2M-F2 | Gcv (%) | 28.89 | 30.25 | 4.50 | 9.64 | 1.13 | 8.62 | 6.01 | 3.09 | 9.77 | 10.33 | 15.72 | 13.39 | 4.15 | 5.69 |
| Hb (%) | 76.88 | 68.23 | 33.12 | 27.86 | 5.64 | 30.23 | 22.69 | 9.13 | 99.53 | 57.92 | 44.64 | 33.60 | 16.52 | 19.62 | |
| ΔGt | 53.99 | 51.48 | 5.34 | 10.48 | 0.55 | 9.77 | 5.89 | 1.93 | 20.12 | 16.19 | 21.63 | 15.99 | 3.47 | 5.19 | |
| Gv | 0.98 | 0.73 | 32.12 | 0.19 | 0.04 | 0.02 | 3.84 | 0.01 | 0.37 | 5.31 | 639.23 | 9.16 | 0.05 | 3.48 |
表6 不同组合F2代主要性状的遗传参数
Table 6 Genetic parameters of main traits in F2 generations of different combinations
组合 Combination | 遗传参数 Genetic parameter | 分蘖数 TN | 有效分蘖数ETN | 株高 PH | 茎粗 SD | 旗叶长 FLL | 旗叶宽 FLW | 倒二叶长 ISLL | 倒二叶宽 ISLW | 叶片数 LN | 主穗长 MPL | 主穗 粒数 GNMP | 千粒重 TKW | 轮层数 RL | 穗下节长 PL |
|---|---|---|---|---|---|---|---|---|---|---|---|---|---|---|---|
| F709-F2 | Gcv (%) | 33.62 | 37.85 | 5.32 | 18.50 | 20.68 | 14.01 | 10.94 | 18.34 | 11.40 | 13.81 | 7.09 | 5.97 | 9.87 | 5.33 |
| Hb (%) | 66.26 | 67.71 | 64.37 | 64.66 | 74.22 | 70.10 | 62.97 | 71.20 | 66.02 | 50.90 | 22.54 | 20.80 | 65.86 | 14.13 | |
| ΔGt | 56.38 | 63.99 | 8.97 | 30.65 | 36.70 | 24.17 | 17.88 | 31.87 | 19.08 | 20.30 | 6.93 | 5.61 | 16.51 | 4.08 | |
| Gv | 0.71 | 0.76 | 44.64 | 0.64 | 16.62 | 0.08 | 17.36 | 0.17 | 0.43 | 10.48 | 138.33 | 1.85 | 0.27 | 3.34 | |
| 709F-F2 | Gcv (%) | 31.28 | 34.41 | 10.27 | 18.98 | 18.89 | 14.60 | 12.43 | 11.85 | 8.66 | 19.35 | 19.03 | 6.95 | 11.55 | 8.30 |
| Hb (%) | 61.22 | 66.21 | 85.41 | 69.76 | 69.27 | 76.93 | 63.74 | 52.87 | 50.94 | 63.04 | 66.01 | 45.59 | 72.93 | 23.81 | |
| ΔGt | 50.41 | 57.68 | 19.55 | 32.65 | 32.39 | 26.38 | 20.44 | 17.75 | 12.73 | 31.65 | 31.86 | 9.67 | 20.31 | 8.35 | |
| Gv | 0.57 | 0.71 | 144.65 | 0.81 | 13.01 | 0.11 | 17.94 | 0.08 | 0.23 | 17.25 | 923.04 | 2.76 | 0.37 | 6.34 | |
| ML2-F2 | Gcv (%) | 33.71 | 30.38 | 5.25 | 10.69 | 13.71 | 4.49 | 7.83 | 10.27 | 11.54 | 12.20 | 2.45 | 8.52 | 5.91 | 10.86 |
| Hb (%) | 69.13 | 60.86 | 39.47 | 28.37 | 50.12 | 9.07 | 33.99 | 53.16 | 99.53 | 62.54 | 1.81 | 29.80 | 23.84 | 50.73 | |
| ΔGt | 57.74 | 48.82 | 6.79 | 11.73 | 19.99 | 2.79 | 9.40 | 15.43 | 23.78 | 19.88 | 0.68 | 9.58 | 5.95 | 15.93 | |
| Gv | 0.66 | 0.53 | 42.30 | 0.20 | 5.67 | 0.01 | 6.74 | 0.05 | 0.41 | 6.44 | 14.58 | 3.97 | 0.08 | 14.67 | |
| L2M-F2 | Gcv (%) | 28.89 | 30.25 | 4.50 | 9.64 | 1.13 | 8.62 | 6.01 | 3.09 | 9.77 | 10.33 | 15.72 | 13.39 | 4.15 | 5.69 |
| Hb (%) | 76.88 | 68.23 | 33.12 | 27.86 | 5.64 | 30.23 | 22.69 | 9.13 | 99.53 | 57.92 | 44.64 | 33.60 | 16.52 | 19.62 | |
| ΔGt | 53.99 | 51.48 | 5.34 | 10.48 | 0.55 | 9.77 | 5.89 | 1.93 | 20.12 | 16.19 | 21.63 | 15.99 | 3.47 | 5.19 | |
| Gv | 0.98 | 0.73 | 32.12 | 0.19 | 0.04 | 0.02 | 3.84 | 0.01 | 0.37 | 5.31 | 639.23 | 9.16 | 0.05 | 3.48 |
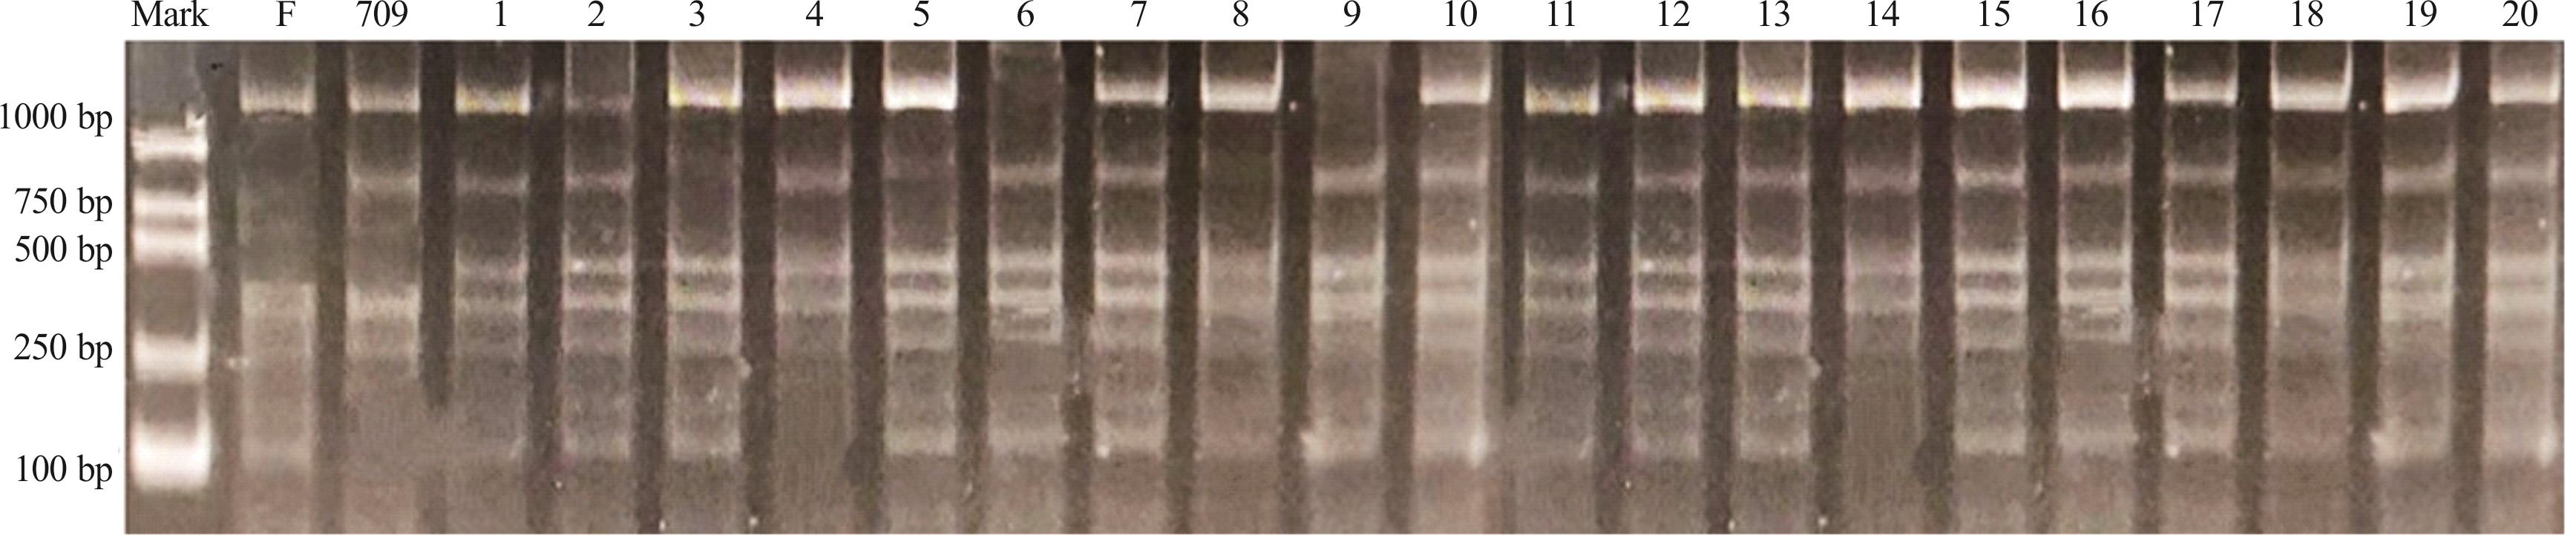
图3 引物AM1789对F709-F2和709F-F2 的扩增1~10代表正交F2群体材料,11~20代表反交材料,下同。1-10 represent some F2 population from forward cross, and 11-20 represent F2 population from reverse cross. The same below.
Fig.3 SSR amplification of F709-F2 and 709F-F2 with primer AM1789
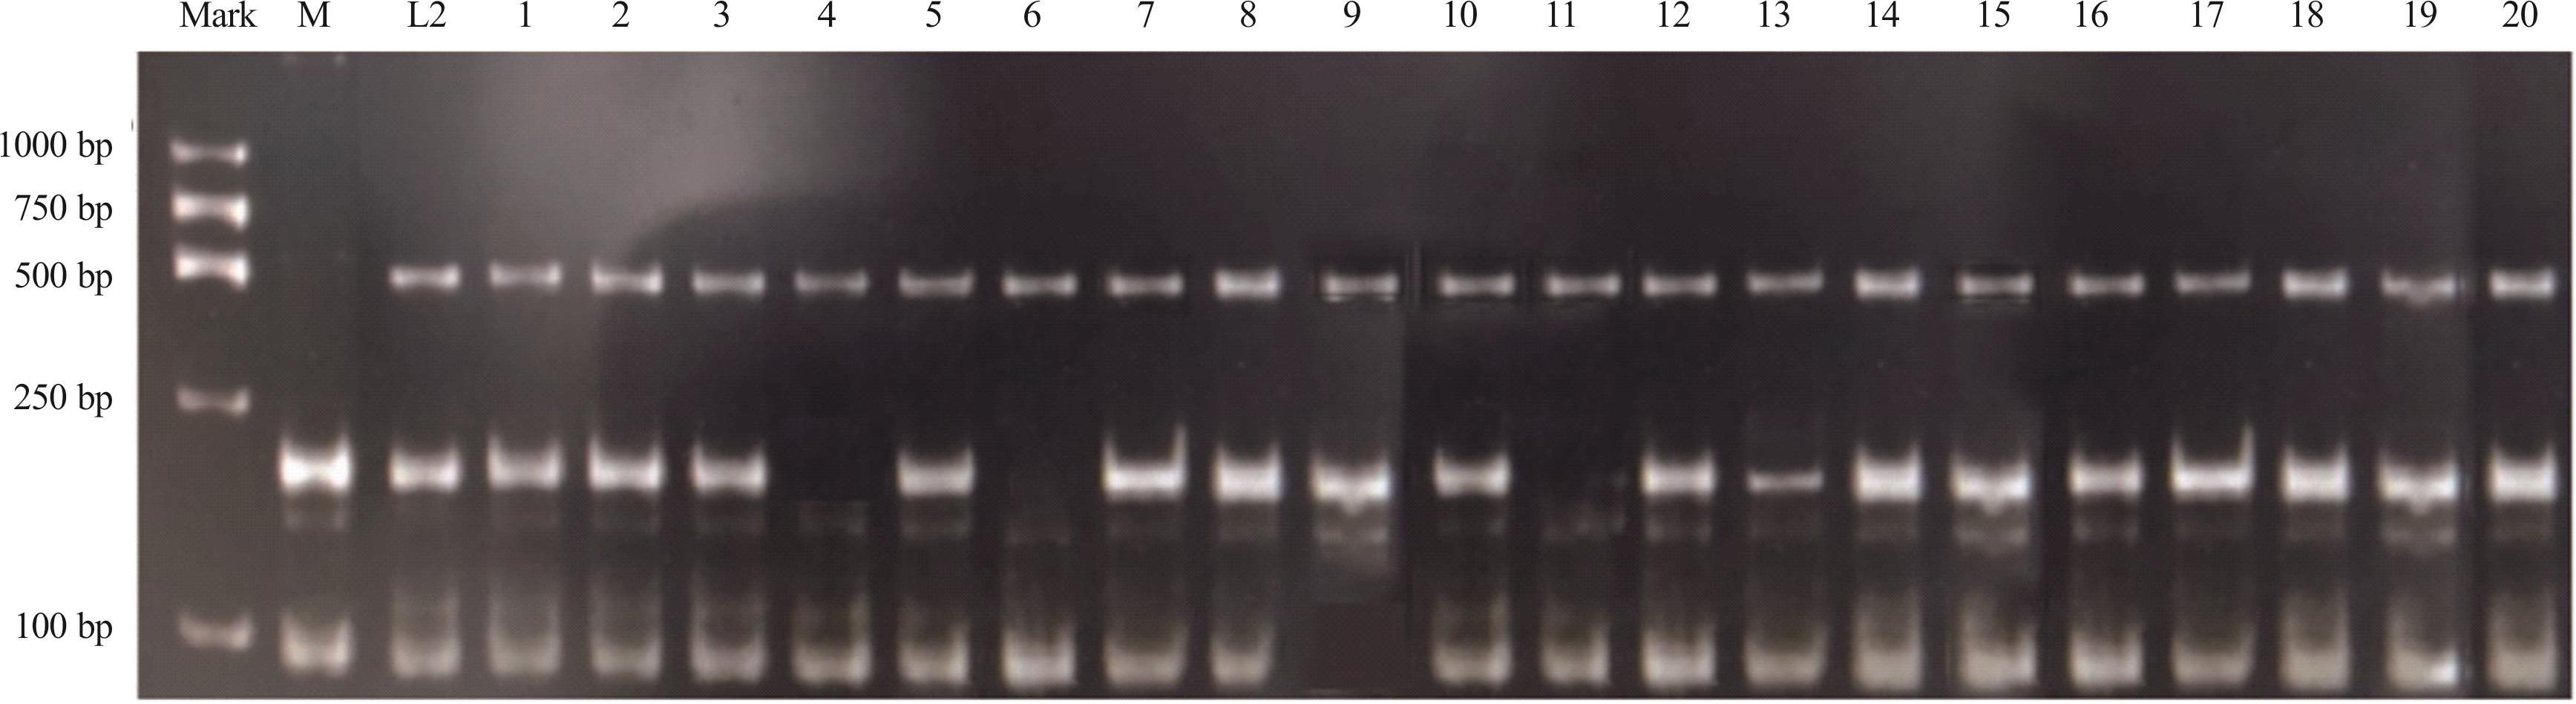
图4 引物AM54对ML2-F2和L2M-F2的扩增
Fig.4 SSR amplification of ML2-F2 and L2M-F2 with primer AM54
| 引物Primer | TNAB | NPB | PR (%) |
|---|---|---|---|
| P15 | 13 | 10 | 76.9 |
| MAMA_2 | 9 | 7 | 77.8 |
| P12 | 13 | 10 | 76.9 |
| AM54 | 10 | 7 | 70.0 |
| P22 | 12 | 8 | 66.7 |
| AM89 | 8 | 6 | 75.0 |
| AM31 | 9 | 6 | 66.7 |
| P38 | 9 | 7 | 77.8 |
| P35 | 8 | 6 | 75.0 |
| AM1789 | 11 | 8 | 72.7 |
| 总和Total | 102 | 75 | - |
| 平均值Mean | 10.2 | 7.5 | 73.5 |
表7 10对引物在杂种F2群体中的多态性统计
Table 7 Polymorphism statistics of 10 pairs of primers in F2 population
| 引物Primer | TNAB | NPB | PR (%) |
|---|---|---|---|
| P15 | 13 | 10 | 76.9 |
| MAMA_2 | 9 | 7 | 77.8 |
| P12 | 13 | 10 | 76.9 |
| AM54 | 10 | 7 | 70.0 |
| P22 | 12 | 8 | 66.7 |
| AM89 | 8 | 6 | 75.0 |
| AM31 | 9 | 6 | 66.7 |
| P38 | 9 | 7 | 77.8 |
| P35 | 8 | 6 | 75.0 |
| AM1789 | 11 | 8 | 72.7 |
| 总和Total | 102 | 75 | - |
| 平均值Mean | 10.2 | 7.5 | 73.5 |
代号 Number | 引物 Primer | 有效等位基因数Effective numbers of alleles | 期望杂合度 Expected heterozygosity | 实际杂合度 Actual heterozygosity | Nei’s基因多态性Nei’s gene polymorphism | 香农指数 Shannon index |
|---|---|---|---|---|---|---|
| F709-F2 | P15 | 2.00 | 0.51 | 0.60 | 0.50 | 0.67 |
| MAMA_2 | 2.00 | 0.51 | 0.75 | 0.50 | 0.69 | |
| P12 | 2.00 | 0.51 | 0.65 | 0.50 | 0.66 | |
| AM54 | 2.00 | 0.51 | 0.75 | 0.50 | 0.69 | |
| P22 | 2.00 | 0.51 | 0.65 | 0.50 | 0.65 | |
| AM89 | 2.00 | 0.51 | 0.65 | 0.50 | 0.69 | |
| AM31 | 1.96 | 0.50 | 0.65 | 0.49 | 0.68 | |
| P38 | 1.92 | 0.49 | 0.60 | 0.48 | 0.67 | |
| P35 | 1.98 | 0.51 | 0.80 | 0.50 | 0.69 | |
| AM1789 | 1.41 | 0.30 | 0.35 | 0.39 | 0.55 | |
| 平均值Mean | 1.92 | 0.49 | 0.65 | 0.47 | 0.67 | |
| 709F-F2 | P15 | 2.00 | 0.51 | 0.75 | 0.50 | 0.69 |
| MAMA_2 | 2.00 | 0.51 | 0.55 | 0.50 | 0.67 | |
| P12 | 1.98 | 0.51 | 0.70 | 0.50 | 0.68 | |
| AM54 | 1.98 | 0.51 | 0.60 | 0.50 | 0.69 | |
| P22 | 1.92 | 0.49 | 0.60 | 0.48 | 0.67 | |
| AM89 | 1.92 | 0.49 | 0.70 | 0.48 | 0.67 | |
| AM31 | 1.98 | 0.51 | 0.70 | 0.50 | 0.69 | |
| P38 | 1.98 | 0.51 | 0.70 | 0.50 | 0.65 | |
| P35 | 1.96 | 0.50 | 0.65 | 0.49 | 0.68 | |
| AM1789 | 1.41 | 0.30 | 0.35 | 0.29 | 0.53 | |
| 平均值Mean | 1.91 | 0.48 | 0.63 | 0.47 | 0.66 |
表8 10对引物在F709-F2和709F-F2中的多样性信息
Table 8 Diversity information of 10 pairs primers in F709-F2 and 709F-F2
代号 Number | 引物 Primer | 有效等位基因数Effective numbers of alleles | 期望杂合度 Expected heterozygosity | 实际杂合度 Actual heterozygosity | Nei’s基因多态性Nei’s gene polymorphism | 香农指数 Shannon index |
|---|---|---|---|---|---|---|
| F709-F2 | P15 | 2.00 | 0.51 | 0.60 | 0.50 | 0.67 |
| MAMA_2 | 2.00 | 0.51 | 0.75 | 0.50 | 0.69 | |
| P12 | 2.00 | 0.51 | 0.65 | 0.50 | 0.66 | |
| AM54 | 2.00 | 0.51 | 0.75 | 0.50 | 0.69 | |
| P22 | 2.00 | 0.51 | 0.65 | 0.50 | 0.65 | |
| AM89 | 2.00 | 0.51 | 0.65 | 0.50 | 0.69 | |
| AM31 | 1.96 | 0.50 | 0.65 | 0.49 | 0.68 | |
| P38 | 1.92 | 0.49 | 0.60 | 0.48 | 0.67 | |
| P35 | 1.98 | 0.51 | 0.80 | 0.50 | 0.69 | |
| AM1789 | 1.41 | 0.30 | 0.35 | 0.39 | 0.55 | |
| 平均值Mean | 1.92 | 0.49 | 0.65 | 0.47 | 0.67 | |
| 709F-F2 | P15 | 2.00 | 0.51 | 0.75 | 0.50 | 0.69 |
| MAMA_2 | 2.00 | 0.51 | 0.55 | 0.50 | 0.67 | |
| P12 | 1.98 | 0.51 | 0.70 | 0.50 | 0.68 | |
| AM54 | 1.98 | 0.51 | 0.60 | 0.50 | 0.69 | |
| P22 | 1.92 | 0.49 | 0.60 | 0.48 | 0.67 | |
| AM89 | 1.92 | 0.49 | 0.70 | 0.48 | 0.67 | |
| AM31 | 1.98 | 0.51 | 0.70 | 0.50 | 0.69 | |
| P38 | 1.98 | 0.51 | 0.70 | 0.50 | 0.65 | |
| P35 | 1.96 | 0.50 | 0.65 | 0.49 | 0.68 | |
| AM1789 | 1.41 | 0.30 | 0.35 | 0.29 | 0.53 | |
| 平均值Mean | 1.91 | 0.48 | 0.63 | 0.47 | 0.66 |
代号 Number | 引物 Primer | 有效等位基因数Effective numbers of alleles | 期望杂合度 Expected heterozygosity | 实际杂合度 Actual heterozygosity | Nei’s基因多态性Nei’s gene polymorphism | 香农指数 Shannon index |
|---|---|---|---|---|---|---|
| ML2-F2 | P15 | 2.00 | 0.51 | 0.85 | 0.50 | 0.69 |
| MAMA_2 | 1.78 | 0.45 | 0.55 | 0.44 | 0.63 | |
| P12 | 1.83 | 0.47 | 0.70 | 0.46 | 0.65 | |
| AM54 | 2.00 | 0.51 | 0.85 | 0.50 | 0.69 | |
| P22 | 1.92 | 0.49 | 0.80 | 0.48 | 0.67 | |
| AM89 | 2.00 | 0.51 | 0.99 | 0.50 | 0.69 | |
| AM31 | 1.78 | 0.45 | 0.55 | 0.44 | 0.63 | |
| P38 | 1.92 | 0.49 | 0.60 | 0.48 | 0.67 | |
| P35 | 2.00 | 0.51 | 0.90 | 0.50 | 0.69 | |
| AM1789 | 1.96 | 0.50 | 0.75 | 0.49 | 0.68 | |
| 平均值Mean | 1.92 | 0.49 | 0.76 | 0.48 | 0.67 | |
| L2M-F2 | P15 | 2.00 | 0.51 | 0.75 | 0.50 | 0.69 |
| MAMA_2 | 1.83 | 0.47 | 0.40 | 0.46 | 0.66 | |
| P12 | 1.92 | 0.49 | 0.80 | 0.48 | 0.67 | |
| AM54 | 1.98 | 0.51 | 0.70 | 0.50 | 0.69 | |
| P22 | 1.98 | 0.51 | 0.70 | 0.50 | 0.71 | |
| AM89 | 2.00 | 0.51 | 0.85 | 0.50 | 0.67 | |
| AM31 | 1.98 | 0.51 | 0.50 | 0.50 | 0.69 | |
| P38 | 2.00 | 0.51 | 0.99 | 0.50 | 0.68 | |
| P35 | 2.00 | 0.51 | 0.90 | 0.50 | 0.69 | |
| AM1789 | 1.92 | 0.49 | 0.60 | 0.48 | 0.67 | |
| 平均值Mean | 1.96 | 0.50 | 0.72 | 0.49 | 0.68 |
表9 10对引物在ML2-F2和L2M-F2中的多样性信息
Table 9 Diversity information of 10 pairs primers in ML2-F2 and L2M-F2
代号 Number | 引物 Primer | 有效等位基因数Effective numbers of alleles | 期望杂合度 Expected heterozygosity | 实际杂合度 Actual heterozygosity | Nei’s基因多态性Nei’s gene polymorphism | 香农指数 Shannon index |
|---|---|---|---|---|---|---|
| ML2-F2 | P15 | 2.00 | 0.51 | 0.85 | 0.50 | 0.69 |
| MAMA_2 | 1.78 | 0.45 | 0.55 | 0.44 | 0.63 | |
| P12 | 1.83 | 0.47 | 0.70 | 0.46 | 0.65 | |
| AM54 | 2.00 | 0.51 | 0.85 | 0.50 | 0.69 | |
| P22 | 1.92 | 0.49 | 0.80 | 0.48 | 0.67 | |
| AM89 | 2.00 | 0.51 | 0.99 | 0.50 | 0.69 | |
| AM31 | 1.78 | 0.45 | 0.55 | 0.44 | 0.63 | |
| P38 | 1.92 | 0.49 | 0.60 | 0.48 | 0.67 | |
| P35 | 2.00 | 0.51 | 0.90 | 0.50 | 0.69 | |
| AM1789 | 1.96 | 0.50 | 0.75 | 0.49 | 0.68 | |
| 平均值Mean | 1.92 | 0.49 | 0.76 | 0.48 | 0.67 | |
| L2M-F2 | P15 | 2.00 | 0.51 | 0.75 | 0.50 | 0.69 |
| MAMA_2 | 1.83 | 0.47 | 0.40 | 0.46 | 0.66 | |
| P12 | 1.92 | 0.49 | 0.80 | 0.48 | 0.67 | |
| AM54 | 1.98 | 0.51 | 0.70 | 0.50 | 0.69 | |
| P22 | 1.98 | 0.51 | 0.70 | 0.50 | 0.71 | |
| AM89 | 2.00 | 0.51 | 0.85 | 0.50 | 0.67 | |
| AM31 | 1.98 | 0.51 | 0.50 | 0.50 | 0.69 | |
| P38 | 2.00 | 0.51 | 0.99 | 0.50 | 0.68 | |
| P35 | 2.00 | 0.51 | 0.90 | 0.50 | 0.69 | |
| AM1789 | 1.92 | 0.49 | 0.60 | 0.48 | 0.67 | |
| 平均值Mean | 1.96 | 0.50 | 0.72 | 0.49 | 0.68 |
| 1 | Zheng D S. Diversity of oat in China. Journal of Plant Genetic Resources, 2010, 11(3): 249-252. |
| 郑殿升. 中国燕麦的多样性. 植物遗传资源学报, 2010, 11(3): 249-252. | |
| 2 | Liu Z H. Processing and functional characteristics of oat food. Modern Food, 2019(20): 133-135. |
| 刘智虎. 燕麦食品加工及功能特性. 现代食品, 2019(20): 133-135. | |
| 3 | Liang G L, Liu W H, Zhou Q P, et al. Primary investigation of hybridization breeding research of several oats. Chinese Qinghai Journal of Animal and Veterinary Sciences, 2016, 46(6): 24-29. |
| 梁国玲, 刘文辉, 周青平, 等. 饲用皮燕麦种间杂交育种研究初报. 青海畜牧兽医杂志, 2016, 46(6): 24-29. | |
| 4 | Ren C Z, Cui L, Yang C, et al. Establishment and application of high efficient breeding technology system of oat in China. Journal of Agricultural Science and Technology, 2016, 18(1): 1-6. |
| 任长忠, 崔林, 杨才, 等. 我国燕麦高效育种技术体系创建与应用. 中国农业科技导报, 2016, 18(1): 1-6. | |
| 5 | Zhang Z. Advantages and disadvantages of hybrid breeding in breeding new varieties. Beijing Agriculture, 2014(12): 31. |
| 张振. 杂交育种在新品种培育中的优缺点. 北京农业, 2014(12): 31. | |
| 6 | Zhao Y H. Study on genetic diversity of 15 oat germplasm materials. Hohhot: Inner Mongolia Normal University, 2018. |
| 赵彦慧. 15份燕麦种质材料的遗传多样性研究. 呼和浩特: 内蒙古师范大学, 2018. | |
| 7 | Shu A P, Liu Z B, Yu L Q, et al. Research progress on genetic diversity in rice based on SSR marker analysis. Journal of Plant Genetic Resources, 2013, 14(5): 778-783. |
| 束爱萍, 刘增兵, 余丽琴, 等. 水稻 SSR标记的遗传多样性研究进展. 植物遗传资源学报, 2013,14(5): 778-783. | |
| 8 | Yi H M, Zhang L K, Ge J R, et al. Comparison of SSRs and field inspection in assessment of seed purity in maize. Journal of Maize Sciences, 2021, 29(4): 29-34. |
| 易红梅, 张力科, 葛建镕, 等. SSR标记与田间种植鉴定玉米品种纯度的比较. 玉米科学, 2021, 29(4): 29-34. | |
| 9 | Zheng Y S, Wang L Y, Duan L L, et al. Genetic diversity analysis of 350 wheat germplasms by SSR markers. Shandong Agricultural Sciences, 2020, 52(12): 1-6. |
| 郑永胜, 王丽媛, 段丽丽, 等. 350份小麦种质的SSR遗传多样性分析. 山东农业科学, 2020, 52(12): 1-6. | |
| 10 | Zhao X, Zhang Y W. Identification of mung bean F1 hybrids by SSR marker. Journal of Shanxi Agricultural Sciences, 2019, 47(3): 307-309. |
| 赵璇, 张耀文. SSR标记鉴定绿豆F1杂种试验. 山西农业科学, 2019, 47(3): 307-309. | |
| 11 | Wang Y, Yi L M, Ban W T, et al. Identification of F1 hybrids of perennial ryegrass based on SSR molecular markers. Chinese Journal of Grassland, 2021, 43(11): 10-18. |
| 汪阳, 易莉美, 班晚婷, 等. 基于SSR分子标记的多年生黑麦草杂交F1代杂种鉴定. 中国草地学报, 2021, 43(11): 10-18. | |
| 12 | Xie W G, Zhang X Q, Chen Y X. Identification and genetic variation analysis of orchardgrass hybrids (Dactylis glomerata) by SSR molecular markers. Acta Prataculturae Sinica, 2010, 19(2): 212-217. |
| 谢文刚, 张新全, 陈永霞. 鸭茅杂交种的SSR分子标记鉴定及其遗传变异分析. 草业学报, 2010, 19(2): 212-217. | |
| 13 | Cui L L. Analysis of alfalfa hybrids and construction of genetic map by SNP markers. Beijing: Chinese Academy of Agricultural Sciences, 2020. |
| 崔乐乐. 紫花苜蓿与黄花苜蓿杂种分析及SNP标记遗传图谱构建. 北京: 中国农业科学院, 2020. | |
| 14 | Yun J F. Breeding of forage and feed crops. Beijing: China Agriculture Press, 2016. |
| 云锦凤. 牧草及饲料作物育种学. 北京: 中国农业出版社, 2016. | |
| 15 | Lu H B, Shi L M, Hu X N, et al. Difference analysis of yield and main agronomic traits in F1 generation of sweet waxy maize. Journal of Zhejiang Agricultural Sciences, 2015, 56(5): 633-634. |
| 卢华兵, 石丽敏, 胡贤女, 等. 甜糯玉米正反交F1代产量和主要农艺性状的差异性分析. 浙江农业科学, 2015, 56(5): 633-634. | |
| 16 | Zhao Y F. SSR and agronomical traits analysis of hybrid F1 and F2 between nine Dactylis glomerata varieties. Chengdu: Sichuan Agricultural University, 2013. |
| 赵一帆. 9个鸭茅品种(系)间杂交F1、F2代农艺性状变异及SSR分析. 成都: 四川农业大学, 2013. | |
| 17 | Wang T Y, Zhu Y F, Chen H Z, et al. Study on differences of main characters between maize hybrids and reciprocal crosses. Journal of Maize Sciences, 2007(4): 52-55. |
| 王天宇, 祝云芳, 陈华璋, 等. 玉米正反交杂交种F1主要性状的差异性分析. 玉米科学, 2007(4): 52-55. | |
| 18 | Yan X W. Genetic mapping and function analysis of Dek44 in maize. Tai’an: Shandong Agricultural University, 2019. |
| 闫旭伟. 玉米Dek44基因遗传定位与功能分析. 泰安: 山东农业大学, 2019. | |
| 19 | Shi J. Genetic effects of heading date genes on photosynthetic traits in rice. Hangzhou: Hangzhou Normal University, 2019. |
| 施俊. 抽穗期基因对水稻光合性状的遗传效应. 杭州: 杭州师范大学, 2019. | |
| 20 | Liu Y H. The experimental evidence for the discovery of indica-type cytoplasmic in Oryza sativa L. ssp. japonica and application estimation. Shenyang: Shenyang Agricultural University, 2015. |
| 刘猷红. 籼型细胞质粳稻发现的实验证据与遗传效应分析. 沈阳: 沈阳农业大学, 2015. | |
| 21 | Zheng D S, Wang X M, Zhang J. Descriptors and data standard for oats (Avena spp.). Beijing: China Agriculture Press, 2006. |
| 郑殿升, 王晓鸣, 张京. 燕麦种质资源描述规范和数据标准. 北京: 中国农业出版社, 2006. | |
| 22 | Yang M M. Effects on genetic integrity of seed aging to Avena nuda L. germplasm resources. Hohhot: Inner Mongolia Normal University, 2017. |
| 杨苗苗. 裸燕麦种子老化处理对其种质资源遗传完整性的影响. 呼和浩特: 内蒙古师范大学, 2017. | |
| 23 | Zhu X L. Evaluation on agronomic characters and genetic variation analysis on oats varieties hybrids generation. Xining: Qinghai University, 2016. |
| 朱晓兰. 青海省皮燕麦品种间杂交后代的农艺性状评价及遗传变异分析. 西宁: 青海大学, 2016. | |
| 24 | Miao Y C, Li J, Liu Z R, et al. Comparison of four polyacrylamide gel DNA staining methods between two nucleic acid dyes UltraPowerTM and G-Red. Molecular Plant Breeding, 2023, 21(8): 2635-2641. |
| 缪迎春, 李瑾, 刘子睿, 等. 核酸染料 UltraPowerTM和G-Red对聚丙烯酰胺凝胶DNA的四种染色方法比较. 分子植物育种, 2023, 21(8): 2635-2641. | |
| 25 | Lin G Q, Xu S C, Huang J C, et al. Analysis of genetic parameters of main characteristics of F2 in different parent forms in soybean. Journal of Plant Genetic Resources, 2001(2): 12-15. |
| 林国强, 徐树传, 黄建成, 等. 大豆不同亲本类型F2主要性状遗传参数分析. 植物遗传资源学报, 2001(2): 12-15. | |
| 26 | Kong F L. Quantitative geneties in plant. Beijing: China Agricultural University Press, 2006. |
| 孔繁玲. 植物数量遗传学. 北京: 中国农业大学出版社, 2006. | |
| 27 | Zhu J C, Guo Y S, Liu Z D, et al. Identification of the F1 hybrids of grape using SSR molecular markers. Journal of Shenyang Agricultural University, 2016, 47(2): 148-152. |
| 朱骏驰, 郭印山, 刘镇东, 等. 利用SSR分子标记鉴定葡萄F1代杂种. 沈阳农业大学学报, 2016, 47(2): 148-152. | |
| 28 | Zhao Y Z, Wang Z X, Sun Z T. Genetic variation and correlation analysis of main characteristics of F2 in crosses of japonica rice. North Rice, 2004(6): 3-7. |
| 赵一洲, 王志兴, 孙中泰. 粳稻杂种F2代主要性状的遗传变异及相关分析. 北方水稻, 2004(6): 3-7. | |
| 29 | Zhang J, Huang L K, Zhang X Q, et al. Comparison of SRAP and SSR markers for hybrid identification of switchgrass (Panicum virgatum). Acta Prataculturae Sinica, 2012, 21(5): 128-133. |
| 张婧, 黄琳凯, 张新全, 等. SRAP与SSR分子标记在柳枝稷杂种鉴定中的比较分析.草业学报, 2012, 21(5): 128-133. | |
| 30 | Liu Q Y, Ding X P, Zhang P, et al. Purity identification of SSR molecular markers in hybrid rice seeds. Anhui Agricultural Science Bulletin, 2021, 27(5): 9-10. |
| 刘奇燕, 丁显萍, 张萍, 等. 杂交水稻种子SSR分子标记纯度鉴定. 安徽农学通报, 2021, 27(5): 9-10. | |
| 31 | Jia Q L, Zhang R H, Wang W Q, et al. Identification and application of EST-SSR markers in Stylosanthes. Molecular Plant Breeding, 2016, 14(5): 1195-1202. |
| 贾庆麟, 张瑞花, 王文强, 等. 柱花草EST-SSR标记的鉴定及应用. 分子植物育种, 2016, 14(5): 1195-1202. | |
| 32 | Deng Y M, Jia X P, Liang L J. Identification methods of hybridity in ornamental plants distant hybridization. Journal of Nuclear Agricultural Sciences, 2016, 30(7): 1308-1315. |
| 邓衍明, 贾新平, 梁丽建. 观赏植物远缘杂交后代的鉴定方法. 核农学报, 2016, 30(7): 1308-1315. | |
| 33 | Gianfranceschi L, Seglias N, Tarchini R, et al. Simple sequence repeats for the genetic analysis of apple. Theoretical and Applied Genetics, 1998, 96(8): 1069-1076. |
| 34 | Zhu Z C. Application of SSR molecular markers in purity identification of maize variety Liangyu 88. Agriculture and Technology, 2021, 41(2): 54-55. |
| 朱志成. SSR分子标记在玉米品种良玉88纯度鉴定上的应用. 农业与技术, 2021, 41(2): 54-55. | |
| 35 | Liao F L, Zhao H, Zhang Y F, et al. Study on detection of seed purity of two-line hybrid rice by simple sequence repeat (SSR)Ⅵ. The veracity of purity detection of the same plant from one variety with different primers. Hubei Agricultural Sciences, 2013, 52(1): 19-21. |
| 廖芳丽, 赵虹, 张宇飞, 等. SSR鉴定水稻两系杂交种纯度的运用与探讨Ⅵ.不同引物判定同一样品植株纯度的准确性. 湖北农业科学, 2013, 52(1): 19-21. | |
| 36 | Guo H L, Chen X, Xue D D, et al. Genetic analysis of morphological characters of zoysiagrass. Acta Prataculturae Sinica, 2012, 21(5): 134-143. |
| 郭海林, 陈宣, 薛丹丹, 等. 结缕草属植物部分外部性状的遗传分析. 草业学报, 2012, 21(5): 134-143. | |
| 37 | Ma X, Dong L H, Jiang L, et al. Effects of positive and reverse crossing of different waxy maize varieties on main characters and yield. Journal of Northeast Agricultural Sciences, 2022, 47(2): 1-6. |
| 马雪, 董丽华, 姜龙, 等. 不同糯玉米品种正反交对主要性状和产量影响的研究. 东北农业科学, 2022, 47(2): 1-6. | |
| 38 | Cao Y Q, Dong L J, Lv G L, et al. Study on genetic law of number of main stem nodes in F2, F3 and BC1F2 of different parents of soybean. Soybean Science & Technology, 2009(1): 18-21. |
| 曹永强, 董丽杰, 吕桂兰, 等. 大豆不同亲本正、反交F2、F3、BC1F2主茎节数遗传规律研究. 大豆科技, 2009(1): 18-21. | |
| 39 | Sun M, Lei X, Zhang X Q, et al. Assessment of genetic variability in prairie grass. Acta Prataculturae Sinica, 2018, 27(1): 131-141. |
| 孙铭, 雷雄, 张新全, 等. 扁穗雀麦优良品系数量性状的变异分析及遗传参数评估. 草业学报, 2018, 27(1): 131-141. | |
| 40 | Wang H, Shi S L, Zhang X Y, et al. Determination of general combining ability and estimation of genetic parameters for yield and quality in alfalfa. Acta Prataculturae Sinica, 2016, 25(3): 126-134. |
| 王虹, 师尚礼, 张旭业, 等. 紫花苜蓿多元杂交后代产量和品质一般配合力分析及遗传参数的估算. 草业学报, 2016, 25(3): 126-134. | |
| 41 | Ma Z Q, Zhao D M, Zhang C Q, et al. Molecular genetic analysis of five spike-related traits in wheat using RIL and immortalized F2 populations. Molecular Genetics and Genomics, 2007, 277(1): 31-42. |
| 42 | Liu Y H, Leng R, Zhang Z R, et al. Preliminary study on heritability and hereditary progress of the main quantitative characters in tumorous stem mustard (Brassica juncea var. tumida Tsen et Lee). Journal of Plant Genetic Resources, 2006, 7(4): 442-444. |
| 刘义华, 冷蓉, 张召荣, 等. 茎瘤芥主要数量性状遗传力和遗传进度的初步研究. 植物遗传资源学报, 2006, 7(4): 442-444. | |
| 43 | Yan G Y, Yang F, Bai Y Y, et al. SSR-based analysis of genetic diversity and quality trait-related markers of 69 Picria felterrae germplasm samples. Chinese Journal of Experimental Traditional Medical Formulae, 2020, 26(4): 174-184. |
| 闫国跃, 杨帆, 白燕远, 等. 69份苦玄参种质SSR遗传多样性及品质性状相关标记分析. 中国实验方剂学杂志, 2020, 26(4): 174-184. | |
| 44 | Ren X F, Deng Y B, Zang G C, et al. A SSR marker analysis of genetic diversity and population genetic structure of bermudagrass in Henan Province. Acta Prataculturae Sinica, 2022, 31(3): 60-70. |
| 任雪锋, 邓亚博, 臧国长, 等. 基于SSR标记的河南省狗牙根遗传多样性及群体遗传结构分析. 草业学报, 2022, 31(3): 60-70. | |
| 45 | Song Z, He X J, Yang C, et al. Genetic diversity analysis of glutinous rice landraces in Guizhou province by SSR markers. Crop Research, 2021, 35(1): 66-71. |
| 宋泽, 何学佳, 杨翠, 等. 贵州地方糯稻品种的SSR遗传多样性分析. 作物研究, 2021, 35(1): 66-71. | |
| 46 | Qi B J. Study on genetic diversity of germplasm resources of oat (Avena sativa L.). Hohhot: Inner Mongolia Agricultural University, 2009. |
| 齐冰洁. 燕麦种质资源遗传多样性研究. 呼和浩特: 内蒙古农业大学, 2009. |
| [1] | 李鸿飞, 周帮伟, 张淼, 施树楠, 李志坚. 不同燕麦品种在呼伦贝尔地区的引种适应性评价[J]. 草业学报, 2024, 33(4): 60-72. |
| [2] | 冯琴, 何小莉, 王斌, 王腾飞, 倪旺, 马霞, 明雪花, 邓建强, 兰剑. 宁夏引黄灌区燕麦与箭筈豌豆的混播效果研究[J]. 草业学报, 2024, 33(3): 107-119. |
| [3] | 鲍根生, 李媛, 冯晓云, 张鹏, 孟思宇. 高寒区氮添加和间作种植互作对燕麦和豌豆根系构型影响的研究[J]. 草业学报, 2024, 33(3): 73-84. |
| [4] | 汪雪, 刘晓静, 王静, 吴勇, 童长春. 连续间作下的紫花苜蓿/燕麦根系与碳氮代谢特性研究[J]. 草业学报, 2024, 33(3): 85-96. |
| [5] | 罗颖, 李聪, 王沛, 田莉华, 汪辉, 周青平, 雷映霞. 低氮胁迫下不同皮燕麦品种早期的响应研究及耐低氮性综合评价[J]. 草业学报, 2024, 33(2): 164-184. |
| [6] | 李文龙, 李峰, 张仲鹃, 王殿清, 王欢, 靳慧卿, 特木热, 胡志玲, 陶雅. 鄂尔多斯高原北部一年两季燕麦种植模式生产性能评价[J]. 草业学报, 2024, 33(1): 159-168. |
| [7] | 张珈敏, 关皓, 李海萍, 贾志锋, 马祥, 刘文辉, 陈有军, 陈仕勇, 蒋永梅, 甘丽, 周青平, 杨丽雪. 混播比例及乳酸菌剂对燕麦-饲用豌豆发酵TMR品质及瘤胃降解特性的影响[J]. 草业学报, 2024, 33(1): 169-181. |
| [8] | 任春燕, 梁国玲, 刘文辉, 刘凯强, 段嘉蕾. 青藏高原高寒地区早熟燕麦资源筛选和适应性评价[J]. 草业学报, 2023, 32(9): 116-129. |
| [9] | 石永红, 高鹏, 方志红, 赵祥, 韩伟, 魏江铭, 刘琳, 李锦臻. 15个进口饲用燕麦品种炭疽病的抗病性评价及损失分析[J]. 草业学报, 2023, 32(9): 130-142. |
| [10] | 董佳琦, 杨艳婷, 范文强, 王佳妮, 石凤翎. 扁蓿豆种内杂种鉴定及其F1和F2代主要农艺性状优势分析[J]. 草业学报, 2023, 32(7): 229-239. |
| [11] | 张振粉, 黄荣, 李向阳, 姚博, 赵桂琴. 基于Illumina MiSeq高通量测序的燕麦种带细菌多样性及功能分析[J]. 草业学报, 2023, 32(7): 96-108. |
| [12] | 王梓凡, 张晓庆, 钟志明, 权欣. 燕麦草捆和草块对彭波半细毛羊采食行为及生产性能的影响[J]. 草业学报, 2023, 32(5): 171-179. |
| [13] | 严翊丹, 聂莹莹, 徐丽君, 高兴发, 饶彦章, 饶雄, 张洪志, 赵查书, 竺艳萍, 朱玉波. 西南山区冬闲田功能型燕麦品种潜力挖掘评价[J]. 草业学报, 2023, 32(4): 42-53. |
| [14] | 魏露萍, 周青平, 刘芳, 林积圳, 詹圆, 汪辉. 遮穗和去颖下燕麦穗部特征变化和穗部光合贡献率估算[J]. 草业学报, 2023, 32(2): 110-118. |
| [15] | 刘建新, 刘瑞瑞, 刘秀丽, 欧晓彬, 贾海燕, 卜婷, 李娜. 盐碱胁迫下外源硫化氢对裸燕麦叶片氨基酸代谢过程的影响[J]. 草业学报, 2023, 32(2): 119-130. |
| 阅读次数 | ||||||
|
全文 |
|
|||||
|
摘要 |
|
|||||