

ISSN 1004-5759 CN 62-1105/S
草业学报 ›› 2025, Vol. 34 ›› Issue (12): 121-133.DOI: 10.11686/cyxb2025019
• 研究论文 • 上一篇
洪自强1( ), 张正珍2, 苏明1, 李翻过1, 周甜1, 吴宏亮1(), 康建宏1()
收稿日期:2025-01-17
修回日期:2025-03-19
出版日期:2025-12-20
发布日期:2025-10-20
通讯作者:
吴宏亮,康建宏
作者简介:E-mail: kangjianhong@163.com基金资助:
Zi-qiang HONG1(), Zheng-zhen ZHANG2, Ming SU1, Fan-guo LI1, Tian ZHOU1, Hong-liang WU1(), Jian-hong KANG1()
Received:2025-01-17
Revised:2025-03-19
Online:2025-12-20
Published:2025-10-20
Contact:
Hong-liang WU,Jian-hong KANG
摘要:
探究滴灌条件下施钾量对玉米干物质积累、转运及产量形成的影响,以期为宁夏旱区玉米高产高效栽培提供理论依据和技术支撑。于2022-2023年在宁夏银川平吉堡农场开展随机区组试验,试验共设6个钾肥处理,分别为0(K0)、60(K1)、120(K2)、180(K3)、240(K4)和300 kg·hm-2(K5)。合理增钾可显著提高玉米干物质积累量,有效提高玉米花前、花后物质转运及对籽粒的贡献率,最终为产量提高奠定基础。2年间K3处理下干物质积累量均达到最大值分别为37826和36610 kg·hm-2,较其他处理分别显著提高6.53%~23.12%和3.62%~18.79%。2年间K3处理下花前转运贡献率(DMRCG)最大,较其他处理分别提高14.84%~81.87%和5.61%~25.84%。2年间K3处理花后物质积累量最大,较其他处理分别提高7.13%~17.44% (P<0.05)和1.48%~16.33%。与K0相比,K3处理干物质积累速率最大时的生长量(Wmax)2年分别显著增加20.63%和18.47%。2年间K3处理最大干物质积累速率(Vmax)较其他处理分别显著提高4.42%~37.21%和1.52%~18.24%,K3处理平均干物质积累速率(Vmean)较其他处理分别提高6.60%~40.50%和4.25%~22.74%。2年间K3处理平均群体生长速率(CGR)最大,较其他处理分别提高4.75%~26.36%和2.93%~17.16%。随着施钾量的增加,玉米产量表现为先增后降趋势,K3处理玉米籽粒产量最大,2年分别为15179和14944 kg·hm-2,较其他处理分别提高2.29%~18.07%和4.32%~28.24%。通径分析表明,在高密度种植条件下,要进一步提升产量,首先要增加百粒重,其次考虑增加穗数和穗粒数。对产量与施钾量进行二次方程拟合,得到2022年经济最佳施钾量为167.25 kg·hm-2,2023年为170.66 kg·hm-2。综合分析得出,在宁夏旱区推荐玉米最佳经济施钾量为167~180 kg·hm-2,从而达到高产高效栽培的目的。
洪自强, 张正珍, 苏明, 李翻过, 周甜, 吴宏亮, 康建宏. 西北旱区滴灌条件下玉米干物质积累、转运及籽粒产量对施钾量的响应[J]. 草业学报, 2025, 34(12): 121-133.
Zi-qiang HONG, Zheng-zhen ZHANG, Ming SU, Fan-guo LI, Tian ZHOU, Hong-liang WU, Jian-hong KANG. Responses of maize dry matter accumulation, translocation and grain yield to potassium application rates under drip irrigation conditions in the arid areas of Northwest China[J]. Acta Prataculturae Sinica, 2025, 34(12): 121-133.
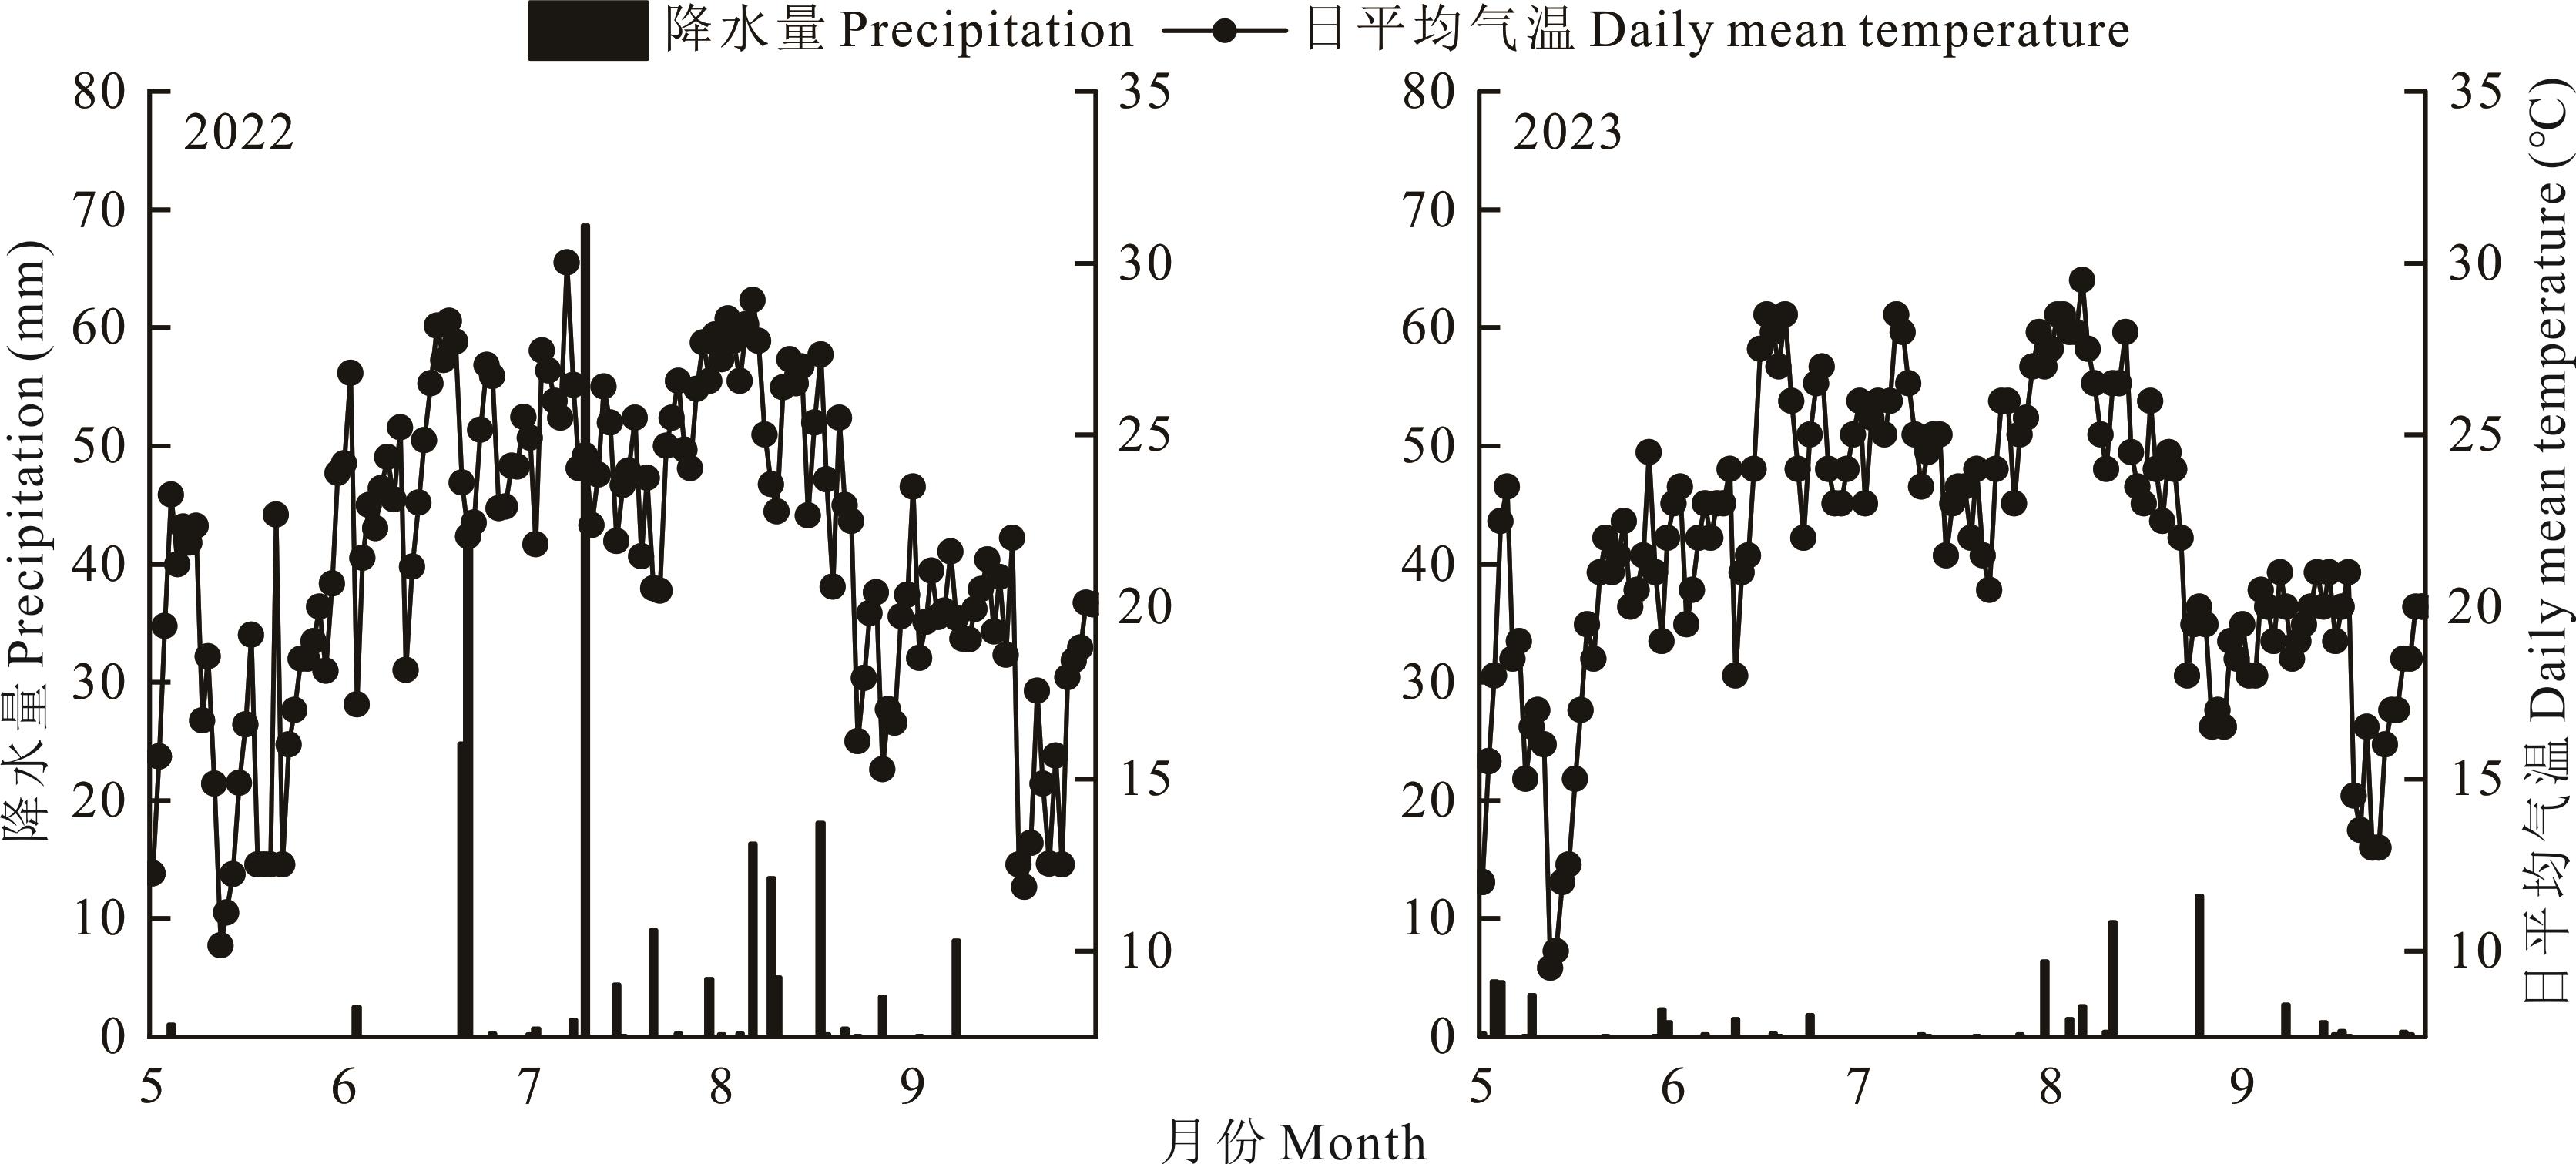
图1 2022和2023年春玉米生育期试验地日平均气温和降水量
Fig. 1 Daily mean temperature and precipitation at the test site during the spring maize growth period in 2022 and 2023
年份 Year | pH | 有机质 Organic matter (g·kg-1) | 全氮 Total nitrogen (g·kg-1) | 碱解氮 Available nitrogen (mg·kg-1) | 速效磷 Available phosphorus (mg·kg-1) | 速效钾 Available potassium (mg·kg-1) |
|---|---|---|---|---|---|---|
| 2022 | 7.68 | 11.86 | 0.80 | 49.00 | 16.89 | 87.62 |
| 2023 | 7.71 | 12.56 | 0.63 | 41.00 | 16.43 | 81.31 |
表1 2022和2023年试验地耕层土壤基本理化性状
Table 1 Basic physical and chemical properties of plough soil in experimental land from 2022 to 2023
年份 Year | pH | 有机质 Organic matter (g·kg-1) | 全氮 Total nitrogen (g·kg-1) | 碱解氮 Available nitrogen (mg·kg-1) | 速效磷 Available phosphorus (mg·kg-1) | 速效钾 Available potassium (mg·kg-1) |
|---|---|---|---|---|---|---|
| 2022 | 7.68 | 11.86 | 0.80 | 49.00 | 16.89 | 87.62 |
| 2023 | 7.71 | 12.56 | 0.63 | 41.00 | 16.43 | 81.31 |
生育时期 Growth period | 2022 | 2023 | ||||
|---|---|---|---|---|---|---|
灌水定额 Irrigation quota (m3·hm-2) | 灌水次数 Number of times of irrigation | 灌水总量 Amount of irrigation (m3·hm-2) | 灌水定额 Irrigation quota (m3·hm-2) | 灌水次数 Number of times of irrigation | 灌水总量 Amount of irrigation (m3·hm-2) | |
| S | 240 | 1 | 240 | 240 | 1 | 240 |
| VE~V6 | 240 | 1 | 240 | 240 | 1 | 240 |
| V6~V12 | 280 | 3 | 840 | 280 | 3 | 840 |
| V12~VT | 300 | 2 | 600 | 320 | 2 | 640 |
| VT~R3 | 300/320/350 | 3 | 970 | 350 | 3 | 1050 |
| R3~R6 | 200 | 1 | 200 | 200 | 1 | 200 |
| 合计Total | 11 | 3090 | 11 | 3210 | ||
表2 玉米各生育时期滴灌水次数与滴灌水量
Table 2 Irrigation frequency and amount for each growth period of maize under drip irrigation
生育时期 Growth period | 2022 | 2023 | ||||
|---|---|---|---|---|---|---|
灌水定额 Irrigation quota (m3·hm-2) | 灌水次数 Number of times of irrigation | 灌水总量 Amount of irrigation (m3·hm-2) | 灌水定额 Irrigation quota (m3·hm-2) | 灌水次数 Number of times of irrigation | 灌水总量 Amount of irrigation (m3·hm-2) | |
| S | 240 | 1 | 240 | 240 | 1 | 240 |
| VE~V6 | 240 | 1 | 240 | 240 | 1 | 240 |
| V6~V12 | 280 | 3 | 840 | 280 | 3 | 840 |
| V12~VT | 300 | 2 | 600 | 320 | 2 | 640 |
| VT~R3 | 300/320/350 | 3 | 970 | 350 | 3 | 1050 |
| R3~R6 | 200 | 1 | 200 | 200 | 1 | 200 |
| 合计Total | 11 | 3090 | 11 | 3210 | ||
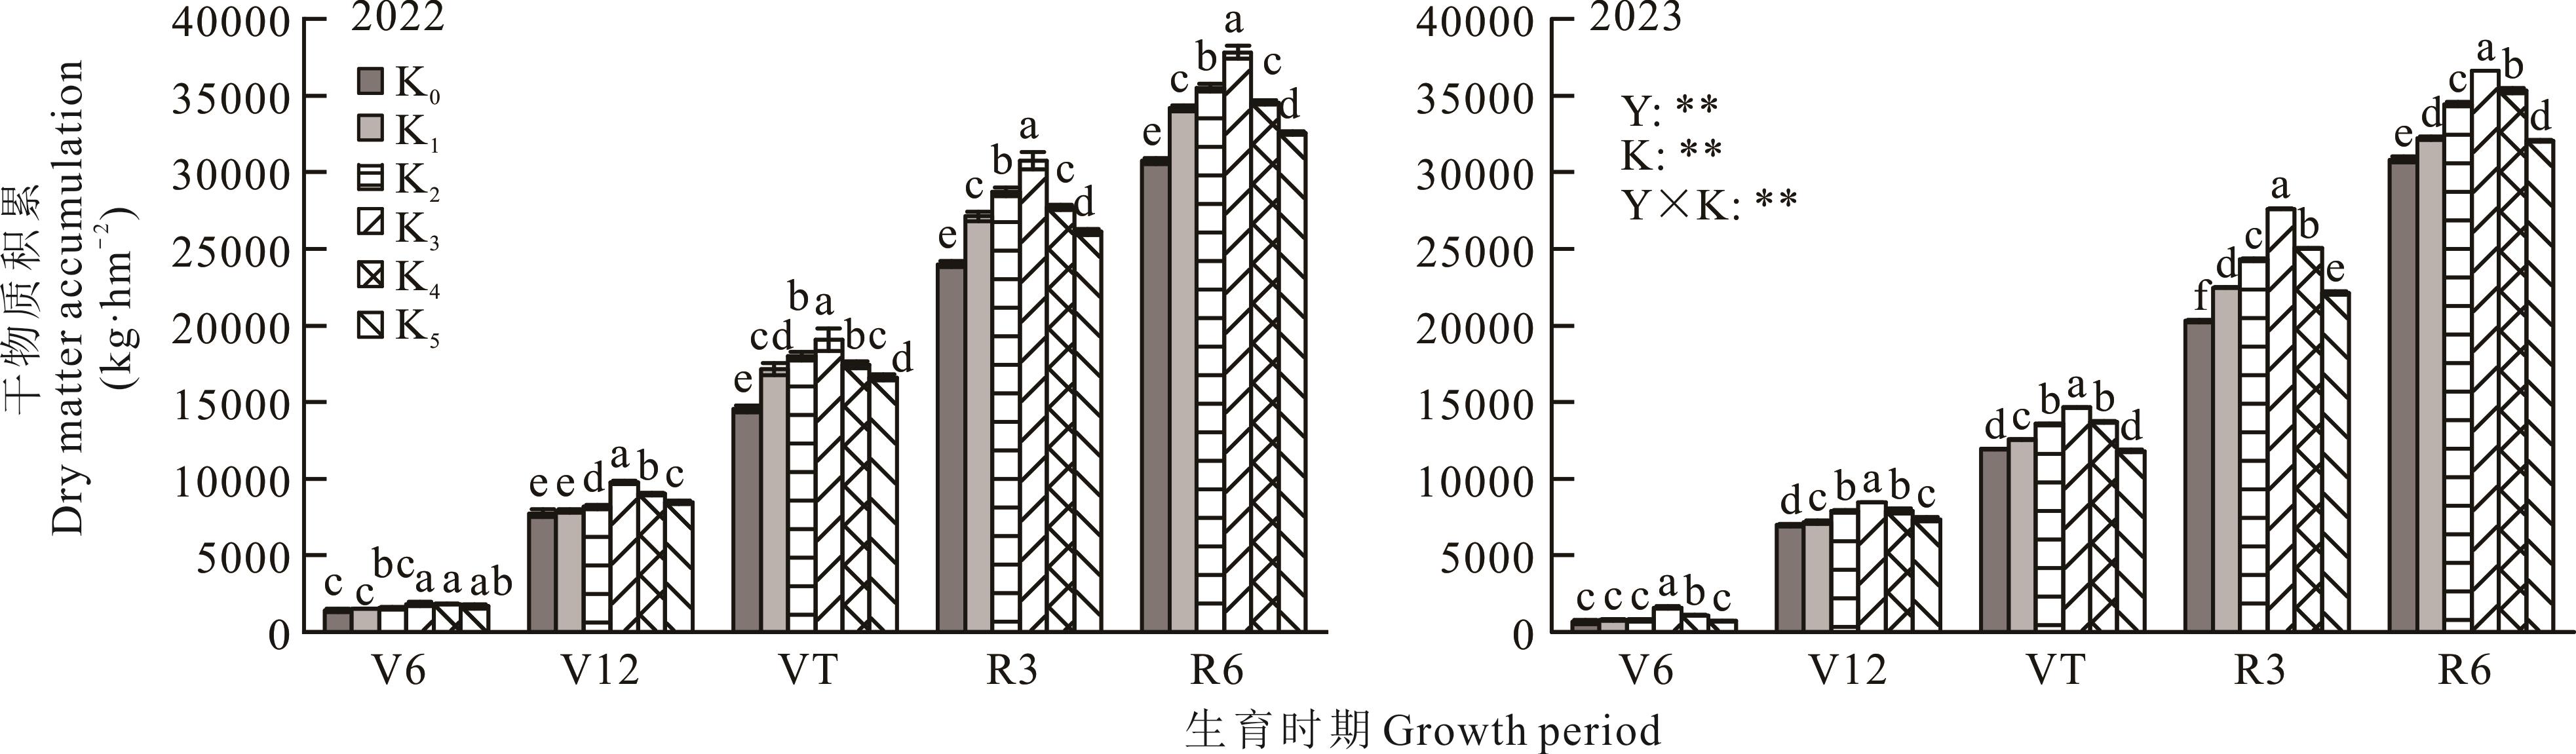
图2 不同施钾量下玉米干物质积累的变化K0、K1、K2、K3、K4、K5表示钾肥用量分别为 0、60、120、180、240、300 kg·hm-2;不同小写字母表示同一时期各处理在P<0.05水平差异显著。Y、K、Y×K分别表示年份、施钾量、年份与施钾量的交互效应。**与*分别表示变量效应达到0.01和0.05显著水平,NS表示效应不显著。下同。The potassium dosage in K0, K1, K2, K3, K4, K5 treatments were 0, 60, 120, 180, 240, 300 kg·ha-1, respectively; Different lowercase letters indicate significant differences among different treatments at the P<0.05 level for the same period. Y, K, and Y×K denote the interaction effects of year, potassium application, and interactive effect of year and potassium application, respectively. ** and * indicate variable effect at 0.01 and 0.05 significant levels, NS indicates not significant. The same below.
Fig. 2 Changes in maize dry matter accumulation under different potassium applications

图3 不同施钾量下玉米干物质分配的变化
Fig. 3 Changes in maize dry matter distribution ratio under different potassium applications
年份 Year | 处理 Treatment | 花前转运量 DMR (kg·hm-2) | 花前转运率 DMRE (%) | 花前转运贡献率 DMRCG (%) | 花后积累量 DMA (kg·hm-2) | 花后积累贡献率 DMAC (%) |
|---|---|---|---|---|---|---|
| 2022 | K0 | 2496.20d | 18.00c | 14.89c | 16178.22d | 85.11a |
| K1 | 4071.84c | 25.88b | 22.30b | 17036.04c | 77.98b | |
| K2 | 5060.46a | 30.63a | 23.58ab | 17492.74b | 74.91cd | |
| K3 | 5216.28a | 30.23a | 27.08a | 18740.72a | 74.06d | |
| K4 | 4801.65ab | 29.86a | 21.39b | 17092.65c | 74.72cd | |
| K5 | 4560.42b | 29.34a | 20.58b | 15957.90d | 76.44bc | |
| 2023 | K0 | 1485.55b | 13.26ab | 8.82b | 18878.95e | 91.19a |
| K1 | 1518.34b | 13.21b | 8.67b | 19642.89d | 91.34a | |
| K2 | 1841.25a | 14.99ab | 10.33ab | 20861.20b | 89.68ab | |
| K3 | 1998.07a | 15.33ab | 10.91a | 21961.62a | 89.09b | |
| K4 | 1881.24a | 15.18ab | 9.82ab | 21641.23a | 90.18ab | |
| K5 | 1708.10ab | 15.71a | 9.28ab | 20230.82c | 90.72ab | |
| 年份Year (Y) | ** | ** | ** | ** | ** | |
| 施钾量Potassium application (K) | ** | ** | ** | ** | ** | |
| 年份×施钾量Y×K | ** | ** | ** | ** | ** | |
表3 不同施钾量下玉米干物质转运的变化及方差分析
Table 3 Changes in maize dry matter translocation and analysis of variance (ANOVA) under different potassium applications
年份 Year | 处理 Treatment | 花前转运量 DMR (kg·hm-2) | 花前转运率 DMRE (%) | 花前转运贡献率 DMRCG (%) | 花后积累量 DMA (kg·hm-2) | 花后积累贡献率 DMAC (%) |
|---|---|---|---|---|---|---|
| 2022 | K0 | 2496.20d | 18.00c | 14.89c | 16178.22d | 85.11a |
| K1 | 4071.84c | 25.88b | 22.30b | 17036.04c | 77.98b | |
| K2 | 5060.46a | 30.63a | 23.58ab | 17492.74b | 74.91cd | |
| K3 | 5216.28a | 30.23a | 27.08a | 18740.72a | 74.06d | |
| K4 | 4801.65ab | 29.86a | 21.39b | 17092.65c | 74.72cd | |
| K5 | 4560.42b | 29.34a | 20.58b | 15957.90d | 76.44bc | |
| 2023 | K0 | 1485.55b | 13.26ab | 8.82b | 18878.95e | 91.19a |
| K1 | 1518.34b | 13.21b | 8.67b | 19642.89d | 91.34a | |
| K2 | 1841.25a | 14.99ab | 10.33ab | 20861.20b | 89.68ab | |
| K3 | 1998.07a | 15.33ab | 10.91a | 21961.62a | 89.09b | |
| K4 | 1881.24a | 15.18ab | 9.82ab | 21641.23a | 90.18ab | |
| K5 | 1708.10ab | 15.71a | 9.28ab | 20230.82c | 90.72ab | |
| 年份Year (Y) | ** | ** | ** | ** | ** | |
| 施钾量Potassium application (K) | ** | ** | ** | ** | ** | |
| 年份×施钾量Y×K | ** | ** | ** | ** | ** | |
年份 Year | 处理 Treatment | 方程参数 Parameters of equation | R2 | 干物质积累参数Dry matter accumulation parameters | |||||
|---|---|---|---|---|---|---|---|---|---|
| A | B | K | Tmax (d) | Wmax (g) | Vmax (g·plant-1·d-1) | Vmean (g·plant-1·d-1) | |||
| 2022 | K0 | 401.90 | 20.93 | 0.06 | 0.99 | 5.85bc | 200.95f | 6.02c | 8.05c |
| K1 | 438.78 | 24.57 | 0.07 | 0.98 | 5.92ab | 219.39d | 7.22b | 9.70b | |
| K2 | 453.10 | 27.77 | 0.07 | 0.99 | 5.99a | 226.55b | 7.91a | 10.61a | |
| K3 | 484.81 | 25.30 | 0.07 | 0.99 | 5.91ab | 242.41a | 8.26a | 11.31a | |
| K4 | 445.82 | 21.28 | 0.06 | 0.99 | 5.81c | 222.91c | 7.10b | 9.86b | |
| K5 | 418.89 | 21.65 | 0.07 | 0.99 | 5.82c | 209.45e | 6.76b | 9.40b | |
| 2023 | K0 | 421.96 | 15.24 | 0.05 | 0.99 | 5.75b | 210.98e | 5.10f | 6.20e |
| K1 | 440.51 | 15.27 | 0.05 | 0.99 | 5.75b | 220.25d | 5.35d | 6.52d | |
| K2 | 468.68 | 15.17 | 0.05 | 0.99 | 5.73b | 234.32c | 5.76c | 7.12c | |
| K3 | 499.88 | 14.14 | 0.05 | 0.99 | 5.68c | 249.94a | 6.03a | 7.61a | |
| K4 | 481.81 | 15.46 | 0.05 | 0.99 | 5.75b | 240.90b | 5.94b | 7.30b | |
| K5 | 442.17 | 15.54 | 0.05 | 0.99 | 5.79a | 221.08d | 5.26e | 6.27e | |
| 年份Year (Y) | - | - | - | - | ** | ** | ** | ** | |
| 施钾量Potassium application (K) | - | - | - | - | * | ** | ** | ** | |
| 年份×施钾量Y×K | - | - | - | - | ** | ** | ** | ** | |
表4 不同施钾量下玉米地上干物质积累的Logistic方程回归分析及方差分析
Table 4 Logistic equation regression analysis and analysis of variance (ANOVA) of aboveground dry matter accumulation of maize under different potassium applications
年份 Year | 处理 Treatment | 方程参数 Parameters of equation | R2 | 干物质积累参数Dry matter accumulation parameters | |||||
|---|---|---|---|---|---|---|---|---|---|
| A | B | K | Tmax (d) | Wmax (g) | Vmax (g·plant-1·d-1) | Vmean (g·plant-1·d-1) | |||
| 2022 | K0 | 401.90 | 20.93 | 0.06 | 0.99 | 5.85bc | 200.95f | 6.02c | 8.05c |
| K1 | 438.78 | 24.57 | 0.07 | 0.98 | 5.92ab | 219.39d | 7.22b | 9.70b | |
| K2 | 453.10 | 27.77 | 0.07 | 0.99 | 5.99a | 226.55b | 7.91a | 10.61a | |
| K3 | 484.81 | 25.30 | 0.07 | 0.99 | 5.91ab | 242.41a | 8.26a | 11.31a | |
| K4 | 445.82 | 21.28 | 0.06 | 0.99 | 5.81c | 222.91c | 7.10b | 9.86b | |
| K5 | 418.89 | 21.65 | 0.07 | 0.99 | 5.82c | 209.45e | 6.76b | 9.40b | |
| 2023 | K0 | 421.96 | 15.24 | 0.05 | 0.99 | 5.75b | 210.98e | 5.10f | 6.20e |
| K1 | 440.51 | 15.27 | 0.05 | 0.99 | 5.75b | 220.25d | 5.35d | 6.52d | |
| K2 | 468.68 | 15.17 | 0.05 | 0.99 | 5.73b | 234.32c | 5.76c | 7.12c | |
| K3 | 499.88 | 14.14 | 0.05 | 0.99 | 5.68c | 249.94a | 6.03a | 7.61a | |
| K4 | 481.81 | 15.46 | 0.05 | 0.99 | 5.75b | 240.90b | 5.94b | 7.30b | |
| K5 | 442.17 | 15.54 | 0.05 | 0.99 | 5.79a | 221.08d | 5.26e | 6.27e | |
| 年份Year (Y) | - | - | - | - | ** | ** | ** | ** | |
| 施钾量Potassium application (K) | - | - | - | - | * | ** | ** | ** | |
| 年份×施钾量Y×K | - | - | - | - | ** | ** | ** | ** | |
| 年份Year | 处理Treatment | V6~V12 | V12~VT | VT~R3 | R3~R6 | 平均Mean |
|---|---|---|---|---|---|---|
| 2022 | K0 | 351.60d | 485.34c | 295.57e | 192.00b | 331.13 |
| K1 | 354.31d | 660.12a | 312.00d | 201.49a | 381.98 | |
| K2 | 366.49cd | 702.82a | 334.88b | 193.62b | 399.45 | |
| K3 | 440.41a | 666.57a | 365.00a | 201.73a | 418.43 | |
| K4 | 399.00b | 603.91b | 320.30c | 195.52b | 379.68 | |
| K5 | 376.45cd | 582.07b | 296.42e | 184.93c | 359.97 | |
| 2023 | K0 | 301.19d | 354.32d | 306.52e | 223.26e | 296.32 |
| K1 | 304.44d | 385.42c | 319.26d | 232.05d | 310.29 | |
| K2 | 339.89a | 405.14b | 345.90b | 241.39bc | 333.08 | |
| K3 | 326.30b | 442.95a | 368.46a | 250.94a | 347.16 | |
| K4 | 323.77bc | 414.16b | 366.07a | 245.07ab | 337.27 | |
| K5 | 316.03c | 318.32e | 332.62c | 236.18cd | 300.79 |
表5 不同施钾量下玉米群体生长速率的变化
Table 5 Changes in maize population growth rate under different potassium applications (kg·hm-2·d-1)
| 年份Year | 处理Treatment | V6~V12 | V12~VT | VT~R3 | R3~R6 | 平均Mean |
|---|---|---|---|---|---|---|
| 2022 | K0 | 351.60d | 485.34c | 295.57e | 192.00b | 331.13 |
| K1 | 354.31d | 660.12a | 312.00d | 201.49a | 381.98 | |
| K2 | 366.49cd | 702.82a | 334.88b | 193.62b | 399.45 | |
| K3 | 440.41a | 666.57a | 365.00a | 201.73a | 418.43 | |
| K4 | 399.00b | 603.91b | 320.30c | 195.52b | 379.68 | |
| K5 | 376.45cd | 582.07b | 296.42e | 184.93c | 359.97 | |
| 2023 | K0 | 301.19d | 354.32d | 306.52e | 223.26e | 296.32 |
| K1 | 304.44d | 385.42c | 319.26d | 232.05d | 310.29 | |
| K2 | 339.89a | 405.14b | 345.90b | 241.39bc | 333.08 | |
| K3 | 326.30b | 442.95a | 368.46a | 250.94a | 347.16 | |
| K4 | 323.77bc | 414.16b | 366.07a | 245.07ab | 337.27 | |
| K5 | 316.03c | 318.32e | 332.62c | 236.18cd | 300.79 |
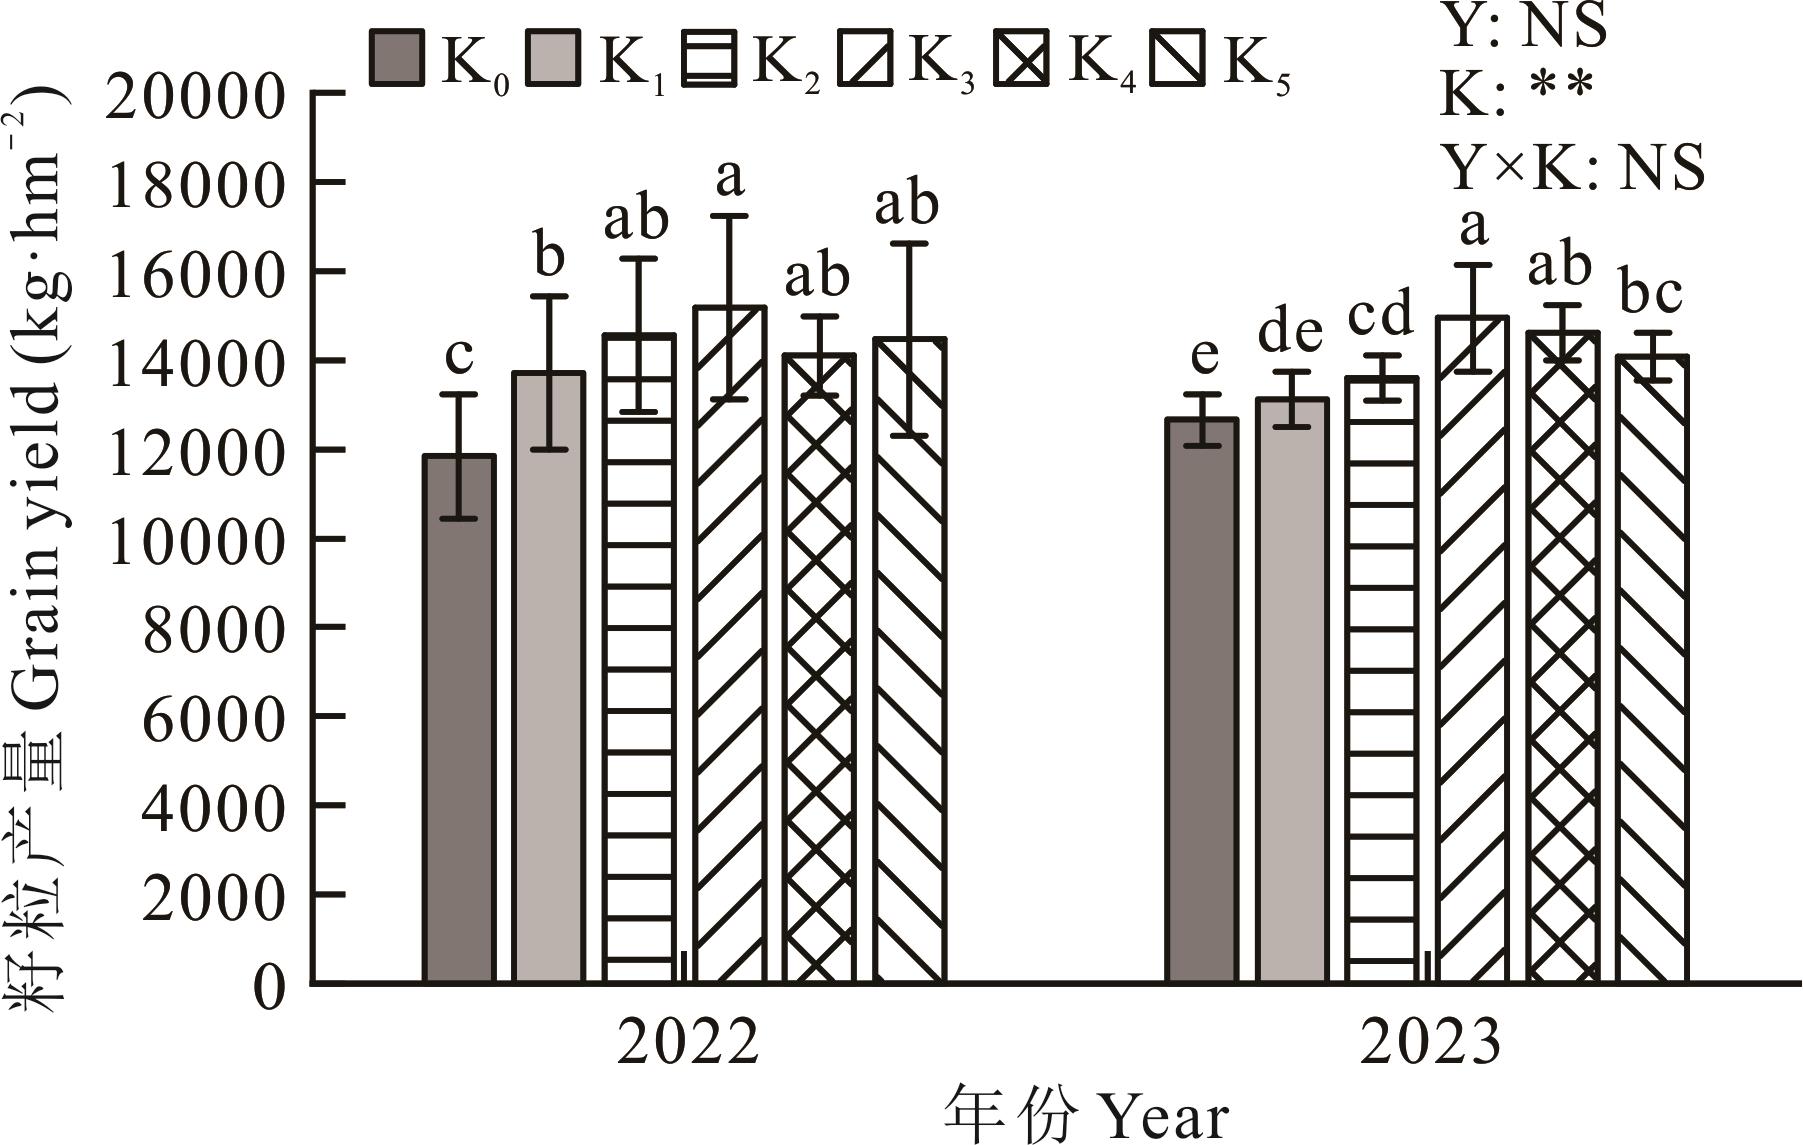
图4 不同施钾量下玉米籽粒产量的变化
Fig.4 Changes in maize grain yield under different potassium applications
年份 Years | 二次函数拟合方程 Quadratic function fitting | R2 | 经济最佳施钾量Economic optimal potassium application (kg·hm-2) | 经济最高产量Economic maximum yield (kg·hm-2) |
|---|---|---|---|---|
| 2022 | y=-0.0756x2+29.768x+11998 | 0.8892 | 167.25 | 14861 |
| 2023 | y=-0.0408x2+18.406x+12420 | 0.8298 | 170.66 | 14372 |
表6 2022和2023年不同施钾量与产量的二次方程关系
Table 6 Quadratic relationship between different potassium applications and yield in 2022 and 2023
年份 Years | 二次函数拟合方程 Quadratic function fitting | R2 | 经济最佳施钾量Economic optimal potassium application (kg·hm-2) | 经济最高产量Economic maximum yield (kg·hm-2) |
|---|---|---|---|---|
| 2022 | y=-0.0756x2+29.768x+11998 | 0.8892 | 167.25 | 14861 |
| 2023 | y=-0.0408x2+18.406x+12420 | 0.8298 | 170.66 | 14372 |
年份 Year | 处理 Treatment | SN (ear·hm-2) | KNE (grain·ear-1) | HGW (g) |
|---|---|---|---|---|
| 2022 | K0 | 59038.33d | 623.40c | 35.67c |
| K1 | 59785.67c | 628.80bc | 36.74c | |
| K2 | 59414.00cd | 625.40c | 40.82ab | |
| K3 | 62380.00a | 698.60ab | 42.54a | |
| K4 | 61386.00b | 716.40a | 37.06c | |
| K5 | 60914.00b | 706.20a | 38.74bc | |
| 2023 | K0 | 61265.33e | 509.60b | 37.91b |
| K1 | 62453.67d | 522.40b | 37.96b | |
| K2 | 62826.67c | 551.00b | 38.08b | |
| K3 | 64746.67a | 620.20a | 39.88ab | |
| K4 | 63232.67b | 609.20a | 41.18a | |
| K5 | 62384.33d | 544.60b | 39.74ab | |
| Y | ** | ** | NS | |
| K | ** | ** | ** | |
| Y×K | ** | NS | ** | |
表7 不同施钾量下玉米产量构成因素的变化及方差分析
Table 7 Changes in maize yield components and analysis of variance (ANOVA) under different potassium applications
年份 Year | 处理 Treatment | SN (ear·hm-2) | KNE (grain·ear-1) | HGW (g) |
|---|---|---|---|---|
| 2022 | K0 | 59038.33d | 623.40c | 35.67c |
| K1 | 59785.67c | 628.80bc | 36.74c | |
| K2 | 59414.00cd | 625.40c | 40.82ab | |
| K3 | 62380.00a | 698.60ab | 42.54a | |
| K4 | 61386.00b | 716.40a | 37.06c | |
| K5 | 60914.00b | 706.20a | 38.74bc | |
| 2023 | K0 | 61265.33e | 509.60b | 37.91b |
| K1 | 62453.67d | 522.40b | 37.96b | |
| K2 | 62826.67c | 551.00b | 38.08b | |
| K3 | 64746.67a | 620.20a | 39.88ab | |
| K4 | 63232.67b | 609.20a | 41.18a | |
| K5 | 62384.33d | 544.60b | 39.74ab | |
| Y | ** | ** | NS | |
| K | ** | ** | ** | |
| Y×K | ** | NS | ** | |
变量 Variable | 作用因子 Effect of factor | 相关系数 Correlation coefficient | 直接通径系数 Direct path coefficients | 间接通径系数Indirect path coefficients | |||
|---|---|---|---|---|---|---|---|
| 合计Total | 穗数SN | 穗粒数KNE | 百粒重HGW | ||||
产量 Yield | 穗数SN | 0.907** | 0.211 | 0.377 | 0.190 | 0.187 | |
| 穗粒数KNE | 0.838* | 0.140 | 0.236 | 0.126 | 0.110 | ||
| 百粒重HGW | 0.942** | 0.646 | 1.079 | 0.571 | 0.508 | ||
表8 不同施钾量下玉米籽粒产量与其构成因素的通径分析
Table 8 Path analysis between maize grain yield and yield components under different potassium applications
变量 Variable | 作用因子 Effect of factor | 相关系数 Correlation coefficient | 直接通径系数 Direct path coefficients | 间接通径系数Indirect path coefficients | |||
|---|---|---|---|---|---|---|---|
| 合计Total | 穗数SN | 穗粒数KNE | 百粒重HGW | ||||
产量 Yield | 穗数SN | 0.907** | 0.211 | 0.377 | 0.190 | 0.187 | |
| 穗粒数KNE | 0.838* | 0.140 | 0.236 | 0.126 | 0.110 | ||
| 百粒重HGW | 0.942** | 0.646 | 1.079 | 0.571 | 0.508 | ||
| [1] | Guo J J, Fan J L, Xiang Y Z, et al. Synchronizing nitrogen supply and uptake by rainfed maize using mixed urea and slow-release nitrogen fertilizer. Nutrient Cycling in Agroecosystems, 2022, 122(2): 157-171. |
| [2] | Jiang C Z, You Y L, Lai X F, et al. Maximizing food equivalent unit yield for forage maize production without notably compromising dry matter yield and feed quality in a semi-arid region. Industrial Crops and Products, 2024, 218(1): 118942. |
| [3] | Dordas C. Variation in dry matter and nitrogen accumulation and remobilization in barley as affected by fertilization, cultivar, and source-sink relations. European Journal of Agronomy, 2012, 37(1): 31-42. |
| [4] | Srivastava A K, Shankar A, Chandran A K N, et al. Emerging concepts of potassium homeostasis in plants. Journal of Experimental Botany, 2020, 71(2): 608-619. |
| [5] | Li J F, Lu J W, Ren T, et al. Crop straw can optimize potassium fertilization strategies in rice cropping system. Better Crops with Plant Food, 2014, 98(3): 13-15. |
| [6] | Wang Y, Wu W H. Potassium transport and signaling in higher plants. Annual Review of Plant Biology, 2013, 64(1): 451-476. |
| [7] | Zhang Z Z, Mu R R, Wang J, et al. Effect of potassium application rate on absorption, transport and yield of maize potassium. Chinese Agricultural Science Bulletin, 2024, 40(8): 47-56. |
| 张正珍, 慕瑞瑞, 王佳, 等. 施钾量对玉米钾素吸收、转运及产量的影响. 中国农学通报, 2024, 40(8): 47-56. | |
| [8] | Yang X, Zhang L, Liu X F. Optimizing water-fertilizer integration with drip irrigation management to improve crop yield, water, and nitrogen use efficiency: A Meta-analysis study. Scientia Horticulturae, 2024, 338: 113653. |
| [9] | Xiao D P, Liu D L, Feng P Y, et al. Future climate change impacts on grain yield and groundwater use under different cropping systems in the North China Plain. Agricultural Water Management, 2021, 246: 106685. |
| [10] | Kong L L, Hou Y P, Yin C X, et al. Optimal plant density and potassium application rate for spring maize under drip-fertigation in Northeast China. Journal of Plant Nutrition and Fertilizers, 2022, 28(10): 1755-1769. |
| 孔丽丽, 侯云鹏, 尹彩侠, 等. 东北春玉米滴灌施肥的适宜种植密度和施钾量研究. 植物营养与肥料学报, 2022, 28(10): 1755-1769. | |
| [11] | Hong Z Q, Zhang Z Z, Zhou T, et al. Optimal potassium dosage for high fluorescence parameters and target yield of spring maize under drip fertigation. Journal of Plant Nutrition and Fertilizers, 2024, 30(8): 1461-1476. |
| 洪自强, 张正珍, 周甜, 等. 水肥一体化下钾肥用量对春玉米光合荧光参数的影响. 植物营养与肥料学报, 2024, 30(8): 1461-1476. | |
| [12] | Gómez R C, Iñiguez P C, Báez W L, et al. Effect of the application of potassium on the yield of corn (Zea mays L.) in La Frailesca, Chiapas Mexico. Brazilian Journal of Development, 2022, 8(4): 29335-29343. |
| [13] | Song J, Wang S X, Li L, et al. Effects of potassium application rate on NPK uptake and utilization and grain yield in summer maize (Zea mays L.). Acta Agronomica Sinica, 2023, 49(2): 539-551. |
| 宋杰, 王少祥, 李亮, 等. 施钾量对夏玉米氮、磷、钾吸收利用和籽粒产量的影响. 作物学报, 2023, 49(2): 539-551. | |
| [14] | Pettigrew W T. Potassium influences on yield and quality production for maize, wheat, soybean and cotton. Physiologia Plantarum, 2008, 133(4): 670-681. |
| [15] | Szulc P, Bocianowski J, Nowosad K, et al. Assessment of the influence of fertilisation and environmental conditions on maize health. Plant Protection Science, 2018, 54(3): 174-182. |
| [16] | Qiu S J, Xi J G, Zhao S C, et al. Long-term effects of potassium fertilization on yield, efficiency, and soil fertility status in a rain-fed maize system in northeast China. Field Crops Research, 2014, 163: 1-9. |
| [17] | Wang F E, Guo Y, Li P, et al. Compensation mechanism of increased maize density on yield with water and nitrogen reduction supply in oasis irrigation areas. Acta Agronomica Sinica, 2024, 50(6): 1616-1627. |
| 王菲儿, 郭瑶, 李盼, 等. 绿洲灌区增密对水氮减量玉米产量的补偿机制. 作物学报, 2024, 50(6): 1616-1627. | |
| [18] | Yang L D, Ren J B, Peng X Y, et al. Crop growth characteristics and its effects on yield formation through nitrogen application and interspecific distance in soybean/maize strip relay intercropping. Acta Agronomica Sinica, 2024, 50(1): 251-264. |
| 杨立达, 任俊波, 彭新月, 等. 施氮与种间距离下大豆/玉米带状套作作物生长特性及其对产量形成的影响. 作物学报, 2024, 50(1): 251-264. | |
| [19] | Su M, Liu Q J, Hong Z Q, et al. Effects of different nitrogen application rates on photosynthetic characteristics and yield formation of potato in semi-arid region of northwest China. Journal of Plant Nutrition and Fertilizers, 2024, 30(10): 1919-1933. |
| 苏明, 柳强娟, 洪自强, 等. 西北半干旱区不同施氮量对马铃薯光合特性及产量形成的影响. 植物营养与肥料学报, 2024, 30(10): 1919-1933. | |
| [20] | Wei T B, Chai Q, Wang W M, et al. Effects of coupling of irrigation and nitrogen application as well as planting density on photosynthesis and dry matter accumulation characteristics of maize in oasis irrigated areas. Scientia Agricultura Sinica, 2019, 52(3): 428-444. |
| 魏廷邦, 柴强, 王伟民, 等. 水氮耦合及种植密度对绿洲灌区玉米光合作用和干物质积累特征的调控效应. 中国农业科学, 2019, 52(3): 428-444. | |
| [21] | Xie J G, Hou Y P, Yin C X, et al. Effect of potassium application and straw returning on spring maize yield, nutrient absorption and soil potassium balance. Journal of Plant Nutrition and Fertilizers, 2014, 20(5): 1110-1118. |
| 谢佳贵, 侯云鹏, 尹彩侠, 等. 施钾和秸秆还田对春玉米产量、养分吸收及土壤钾素平衡的影响. 植物营养与肥料学报, 2014, 20(5): 1110-1118. | |
| [22] | Yin C X, Li Q, Kong L L, et al. The effects of potassium management on maize yield, potassium absorption and utilization under mulched drip irrigation. Journal of Northeast Agricultural Sciences, 2020, 45(3): 35-40. |
| 尹彩侠, 李前, 孔丽丽, 等. 覆膜滴灌施肥条件下钾肥运筹对玉米产量及钾素吸收利用的影响. 东北农业科学, 2020, 45(3): 35-40. | |
| [23] | Pottosin I, Dobrovinskaya O. Non-selective cation channels in plasma and vacuolar membranes and their contribution to K+ transport. Journal of Plant Physiology, 2014, 171(9): 732-742. |
| [24] | Guo B, Chen B, Wu D Z, et al. Effects of potassium ion on adventitious bud induction of Amygdalus pedunculata. Plant Physiology Journal, 2013, 49(12): 1355-1358. |
| 郭斌, 陈邦, 吴道长, 等. 钾离子对长柄扁桃不定芽诱导的影响. 植物生理学报, 2013, 49(12): 1355-1358. | |
| [25] | Chen Y H, Zhang S Y, Du S F, et al. Effects of exogenous potassium (K+) application on the antioxidant enzymes activities in leaves of Tamarix ramosissima under NaCl stress. Genes, 2022, 13(9): 1507. |
| [26] | Du Q, Zhao X H, Xia L, et al. Effects of potassium deficiency on photosynthesis, chloroplast ultrastructure, ROS, and antioxidant activities in maize (Zea mays L.). Journal of Integrative Agriculture, 2019, 18(2): 395-406. |
| [27] | Latifmanesh H, Deng A X, Nawaz M M, et al. Integrative impacts of rotational tillage on wheat yield and dry matter accumulation under corn-wheat cropping system. Soil & Tillage Research, 2018, 184: 100-108. |
| [28] | Wang P F, Yu A Z, Wang Y L, et al. Effects of returning green manure to field combined with reducing nitrogen application on the dry matter accumulation, distribution and yield of maize. Scientia Agricultura Sinica, 2023, 56(7): 1283-1294. |
| 王鹏飞, 于爱忠, 王玉珑, 等. 绿肥还田结合减量施氮对玉米干物质积累分配及产量的影响. 中国农业科学, 2023, 56(7): 1283-1294. | |
| [29] | Hou Y P, Kong L L, Yin C X, et al. Interaction between nitrogen fertilizer and plant density on nutrient absorption, translocation and yield of spring maize under drip irrigation in Northeast China. Journal of Plant Nutrition and Fertilizers, 2021, 27(1): 54-65. |
| 侯云鹏, 孔丽丽, 尹彩侠, 等. 覆膜滴灌下氮肥与种植密度互作对东北春玉米产量、群体养分吸收与转运的调控效应. 植物营养与肥料学报, 2021, 27(1): 54-65. | |
| [30] | Li C S, Tang Y L, Wu C, et al. Effect of N rate on growth and grain filling of wheat in Sichuan Basin. Journal of Plant Nutrition and Fertilizers, 2015, 21(4): 873-883. |
| 李朝苏, 汤永禄, 吴春, 等. 施氮量对四川盆地小麦生长及灌浆的影响. 植物营养与肥料学报, 2015, 21(4): 873-883. | |
| [31] | Li S. Effects of nitrogen-density interaction on dry matter accumulation, nutrient use and yield of maize. Zhengzhou: Henan Agricultural University, 2017. |
| 李帅. 施氮量和密度互作对玉米干物质累积、养分吸收利用及产量的影响. 郑州: 河南农业大学, 2017. | |
| [32] | Li Y F. Effects of potassium nutrition on photosynthesis and carbon and nitrogen metabolism of foxtail millet. Taiyuan: Shanxi Agricultural University, 2022. |
| 李艳芬. 钾素营养对谷子光合作用和碳氮代谢的影响. 太原: 山西农业大学, 2022. | |
| [33] | Yang P, Zhai X Y, Huang H Q, et al. Association and driving factors of meteorological drought and agricultural drought in Ningxia, Northwest China. Atmospheric Research, 2023, 289: 106753. |
| [34] | Zorb C, Senbayram M, Peiter E. Potassium in agriculture-Status and perspectives. Journal of Plant Physiology, 2014, 171(9): 656-669. |
| [35] | Zhang M L, Hu Y Y, Han W, et al. Potassium nutrition of maize: Uptake, transport, utilization, and role in stress tolerance. The Crop Journal, 2023, 11(4): 1048-1058. |
| [36] | Frei J, Wiesenberg G L B, Hirte J. The impact of climate and potassium nutrition on crop yields: Insights from a 30-year Swiss long-term fertilization experiment. Agriculture, Ecosystems and Environment, 2024, 372: 109100. |
| [37] | Zhao X H, Yu H Q, Wen J, et al. Response of root morphology, physiology and endogenous hormones in maize (Zea mays L.) to potassium deficiency. Journal of Integrative Agriculture, 2016, 15(4): 785-794. |
| [38] | Tan J, Kong F L, Zeng H, et al. The suitable potassium fertilizer rate in spring maize in hilly area of central Sichuan Basin, China. Journal of Plant Nutrition and Fertilizers, 2016, 22(3): 838-846. |
| 谭杰, 孔凡磊, 曾晖, 等. 川中丘陵春玉米适宜钾肥用量研究. 植物营养与肥料学报, 2016, 22(3): 838-846. | |
| [39] | Mu R R. Effects of different potassium rates on yield and starch formation of spring maize integrated with drip irrigation. Yinchuan: Ningxia University, 2019. |
| 慕瑞瑞. 不同施钾量对滴灌水肥一体化春玉米产量和淀粉形成的影响. 银川: 宁夏大学, 2019. | |
| [40] | Khan A A, Khan M N, Inamuallah, et al. Effect of potash application on growth, yield and yield components of spring maize hybrids. Pure and Applied Biology, 2015, 4(2): 195-203. |
| [41] | Liao Y L. Studies on evolution of potassium in reddish paddy soil under long-term fertilizer and rice straws application. Changsha: Hunan Agricultural University, 2010. |
| 廖育林. 长期施用化肥和稻草下红壤性水稻土钾素肥力演变规律的研究. 长沙: 湖南农业大学, 2010. |
| [1] | 袁玖. 绿豆衣、大蒜皮、茄子皮与玉米秸秆青贮料、精料间饲料组合效应研究[J]. 草业学报, 2025, 34(9): 173-184. |
| [2] | 李长青, 宋亚茹, 肖凡, 缪春语, 孙梦宇, 纪萌, 孙志梅. 耐瘠高产型玉米品种主要农艺性状特征分析[J]. 草业学报, 2025, 34(9): 97-110. |
| [3] | 张邦彦, 谢小伟, 张朝辉, 武晋民, 王彬, 许兴. 有机-无机改良物料对盐碱地土壤质量及湖南稷子产量的影响[J]. 草业学报, 2025, 34(8): 15-29. |
| [4] | 毛海龙, 邰继承, 杨恒山, 张玉芹, 张瑞富, 王真真. 带型配置对青贮玉米-大豆复合种植体冠层特性、产量和品质的影响[J]. 草业学报, 2025, 34(8): 30-42. |
| [5] | 张译尹, 王斌, 王腾飞, 兰剑, 胡海英. 苜蓿种子田间作小黑麦对饲草产量、水分利用及苜蓿种子产量的影响[J]. 草业学报, 2025, 34(8): 43-53. |
| [6] | 樊文娟, 宋建超, 张小娟, 盛宇航, 史金涛, 张龙骥, 鱼小军. 氮磷配施对甘肃省武威灌区扁蓿豆种子产量和质量的影响[J]. 草业学报, 2025, 34(8): 54-65. |
| [7] | 蒋学乾, 杨青川, 康俊梅. 紫花苜蓿在干旱胁迫下的产量损失与抗旱性遗传研究进展[J]. 草业学报, 2025, 34(7): 219-234. |
| [8] | 孔天赐, 马学青, 贺晨帮, 樊泰延, 芦光新, 祁鹤兴. 青贮玉米真菌性病害对青贮发酵微生物多样性的影响[J]. 草业学报, 2025, 34(7): 95-106. |
| [9] | 姜沛沛, 郭锦花, 肖慧淑, 彭彦珉, 张军, 田文仲, 吕军杰, 吴金芝, 王贺正, 付国占, 黄明, 李友军. 轮耕模式对旱地玉-麦两熟体系作物产量和品质的影响[J]. 草业学报, 2025, 34(6): 181-192. |
| [10] | 刘启林, 王小军, 王金兰, 刘文辉, 马巧玲, 李建辉, 张生原, 曹文侠, 李文. 氮磷配施对高寒区老芒麦饲草产量的影响[J]. 草业学报, 2025, 34(6): 193-202. |
| [11] | 匡宗洋, 穆麟, 魏岚, 郭阳, 胥贵, 陈瑶, 石雪云, 魏仲珊, 张志飞. 不同混合比例和乳酸菌添加对全株玉米和大豆混合青贮品质及有氧稳定性的影响[J]. 草业学报, 2025, 34(6): 227-238. |
| [12] | 秦文利, 张静, 肖广敏, 崔素倩, 叶建勋, 智健飞, 张立锋, 谢楠, 冯伟, 刘振宇, 潘璇, 代云霞, 刘忠宽. 绿肥部分替代化肥氮对土壤物理性状的影响[J]. 草业学报, 2025, 34(6): 27-45. |
| [13] | 刘耀博, 裴渌, 刘琛琢, 李晓霞, 邹博坤. 基于Meta分析中国老芒麦种子产量和产量组分对施肥的响应[J]. 草业学报, 2025, 34(6): 85-98. |
| [14] | 董晓慧, 师尚礼, 尹国丽, 陈三冬, 巩海强, 刘林波. 玉米器官组织内生细菌和真菌群落多样性[J]. 草业学报, 2025, 34(5): 130-145. |
| [15] | 冯雅琪, 陈嘉慧, 张静妮, 隋超, 陈基伟, 刘志鹏, 周强, 刘文献. 基于重测序紫花苜蓿高蛋白、高产关联InDel分子标记开发[J]. 草业学报, 2025, 34(4): 137-149. |
| 阅读次数 | ||||||
|
全文 |
|
|||||
|
摘要 |
|
|||||