
ISSN 1004-5759 CN 62-1105/S
Acta Prataculturae Sinica ›› 2025, Vol. 34 ›› Issue (12): 170-182.DOI: 10.11686/cyxb2025012
Gui FU1,2,4( ), Yu-ping LIU3,4,5, Xu SU3,4,5(), Rong-ju QU3, Cairangzhaxi3
Received:2025-01-16
Revised:2025-03-31
Online:2025-12-20
Published:2025-10-20
Contact:
Xu SU
Gui FU, Yu-ping LIU, Xu SU, Rong-ju QU, Cairangzhaxi. Population genetic diversity and genetic structure analysis of Littledalea przevalskyi based on SSR molecular marker[J]. Acta Prataculturae Sinica, 2025, 34(12): 170-182.
| 居群Population | 数量Number | 采样地Sampling region | 纬度Latitude (N) | 经度Longitude (E) | 海拔Altitude (m) |
|---|---|---|---|---|---|
| POP1 | 5 | 青海省格尔木市Geermu City, Qinghai Province | 34°48′46.5″ | 92°55′32.9″ | 4631 |
| POP2 | 4 | 青海省格尔木市Geermu City, Qinghai Province | 34°22′52.8″ | 92°38′25.3″ | 4604 |
| POP3 | 5 | 青海省格尔木市Geermu City, Qinghai Province | 35°00′6.3″ | 94°26′15.7″ | 4518 |
| POP4 | 5 | 青海省格尔木市Geermu City, Qinghai Province | 35°22′12.7″ | 93°27′45.7″ | 4506 |
| POP5 | 5 | 青海省玛多县Maduo County, Qinghai Province | 34°34′58.9″ | 99°08′3.6″ | 4422 |
| POP6 | 5 | 青海省玛多县Maduo County, Qinghai Province | 34°42′37.6″ | 99°05′21.2″ | 4519 |
| POP7 | 4 | 青海省玛多县Maduo County, Qinghai Province | 34°45′52.2″ | 99°02′57.1″ | 4604 |
| POP8 | 5 | 青海省玛多县Maduo County, Qinghai Province | 34°49′23.5″ | 99°02′32.3″ | 4676 |
| POP9 | 5 | 青海省玛多县Maduo County, Qinghai Province | 34°58′7.0″ | 98°54′6.3″ | 4326 |
| POP10 | 5 | 青海省玛多县Maduo County, Qinghai Province | 35°03′30.6″ | 98°40′41.9″ | 4508 |
| POP11 | 5 | 青海省玛多县Maduo County, Qinghai Province | 34°41′24.1″ | 98°04′51.3″ | 4325 |
| POP12 | 5 | 青海省玛多县Maduo County, Qinghai Province | 34°35′30.9″ | 97°59′7.1″ | 4307 |
| POP13 | 5 | 青海省玛沁县Maqin County, Qinghai Province | 34°32′17.6″ | 99°08′51.7″ | 4398 |
| POP14 | 5 | 青海省曲麻莱县Qumalai County, Qinghai Province | 33°52′17.4″ | 96°29′23.2″ | 4027 |
| POP15 | 5 | 青海省曲麻莱县Qumalai County, Qinghai Province | 34°09′10.0″ | 95°56′53.2″ | 4814 |
| POP16 | 5 | 青海省曲麻莱县Qumalai County, Qinghai Province | 34°21′55.2″ | 95°40′51.5″ | 4468 |
| POP17 | 5 | 青海省曲麻莱县Qumalai County, Qinghai Province | 35°24′41.2″ | 95°34′14.7″ | 4472 |
| POP18 | 5 | 青海省玉树市Yushu City, Qinghai Province | 33°07′7.9″ | 96°44′13.8″ | 4257 |
| POP19 | 5 | 青海省玉树市Yushu City, Qinghai Province | 33°05′33.6″ | 96°47′42.9″ | 4068 |
| POP20 | 3 | 青海省称多县Chenduo County, Qinghai Province | 34°07′31.7″ | 97°39′21.9″ | 4826 |
| POP21 | 5 | 西藏类乌齐县Riwoqê County, Xizang | 30°49′4.3″ | 96°41′13.0″ | 4501 |
Table 1 Detailed information of origins for L. przevalskyi populations
| 居群Population | 数量Number | 采样地Sampling region | 纬度Latitude (N) | 经度Longitude (E) | 海拔Altitude (m) |
|---|---|---|---|---|---|
| POP1 | 5 | 青海省格尔木市Geermu City, Qinghai Province | 34°48′46.5″ | 92°55′32.9″ | 4631 |
| POP2 | 4 | 青海省格尔木市Geermu City, Qinghai Province | 34°22′52.8″ | 92°38′25.3″ | 4604 |
| POP3 | 5 | 青海省格尔木市Geermu City, Qinghai Province | 35°00′6.3″ | 94°26′15.7″ | 4518 |
| POP4 | 5 | 青海省格尔木市Geermu City, Qinghai Province | 35°22′12.7″ | 93°27′45.7″ | 4506 |
| POP5 | 5 | 青海省玛多县Maduo County, Qinghai Province | 34°34′58.9″ | 99°08′3.6″ | 4422 |
| POP6 | 5 | 青海省玛多县Maduo County, Qinghai Province | 34°42′37.6″ | 99°05′21.2″ | 4519 |
| POP7 | 4 | 青海省玛多县Maduo County, Qinghai Province | 34°45′52.2″ | 99°02′57.1″ | 4604 |
| POP8 | 5 | 青海省玛多县Maduo County, Qinghai Province | 34°49′23.5″ | 99°02′32.3″ | 4676 |
| POP9 | 5 | 青海省玛多县Maduo County, Qinghai Province | 34°58′7.0″ | 98°54′6.3″ | 4326 |
| POP10 | 5 | 青海省玛多县Maduo County, Qinghai Province | 35°03′30.6″ | 98°40′41.9″ | 4508 |
| POP11 | 5 | 青海省玛多县Maduo County, Qinghai Province | 34°41′24.1″ | 98°04′51.3″ | 4325 |
| POP12 | 5 | 青海省玛多县Maduo County, Qinghai Province | 34°35′30.9″ | 97°59′7.1″ | 4307 |
| POP13 | 5 | 青海省玛沁县Maqin County, Qinghai Province | 34°32′17.6″ | 99°08′51.7″ | 4398 |
| POP14 | 5 | 青海省曲麻莱县Qumalai County, Qinghai Province | 33°52′17.4″ | 96°29′23.2″ | 4027 |
| POP15 | 5 | 青海省曲麻莱县Qumalai County, Qinghai Province | 34°09′10.0″ | 95°56′53.2″ | 4814 |
| POP16 | 5 | 青海省曲麻莱县Qumalai County, Qinghai Province | 34°21′55.2″ | 95°40′51.5″ | 4468 |
| POP17 | 5 | 青海省曲麻莱县Qumalai County, Qinghai Province | 35°24′41.2″ | 95°34′14.7″ | 4472 |
| POP18 | 5 | 青海省玉树市Yushu City, Qinghai Province | 33°07′7.9″ | 96°44′13.8″ | 4257 |
| POP19 | 5 | 青海省玉树市Yushu City, Qinghai Province | 33°05′33.6″ | 96°47′42.9″ | 4068 |
| POP20 | 3 | 青海省称多县Chenduo County, Qinghai Province | 34°07′31.7″ | 97°39′21.9″ | 4826 |
| POP21 | 5 | 西藏类乌齐县Riwoqê County, Xizang | 30°49′4.3″ | 96°41′13.0″ | 4501 |
引物 Primer | 重复基元 Repetition type | 正向引物 Forward primer (5′-3′) | 反向引物 Reverse primer (5′-3′) | 退火温度Annealing temperature (℃) |
|---|---|---|---|---|
| SR57 | (GTTGG)5 | TGATGATTGGAGCGAGCGAAGT | GAGAAGCGAAAAAAAGGGAGGC | 57.5 |
| SR78 | (GTAG)5 | GGGTCCTTTACCTGACTCCTC | CACCCAATCGCAAACAGC | 56.5 |
| SR87 | (CAAT)5 | TCCCGCAAGGAAAAAGAG | CAGCACAAACGAAAAATAAAAATA | 51.0 |
| SR91 | (GAGCCT)5 | ATCGCCCGTGTCTCCTGTTTC | CGCAAGAAAACATCTCCACACAAGT | 57.5 |
| SR106 | (GGTT)7 | CAAAGTCGTGGGTCAGGTGTC | CCACAAGAACCAGCCAATACAAA | 57.5 |
| SR108 | (TGTA)10 | AGGCACAACTAATAGCAAGCA | CAATCGCTAACGCTGACG | 55.0 |
| SR112 | (GCCT)6 | GCAGCCGCCGACTACCTACT | AAACCACCGCGAAGACAACA | 59.5 |
| SR119 | (ATTT)5 | GGACCTGACCATCCATCTAAACT | TCGTTCTCGGTCGCTTTGT | 57.5 |
| SR120 | (CTAT)10 | CGGCTGCTCTTGGTTGATG | CGGTTAGGTGGGCTGGTTC | 60.5 |
| SR121 | (TGAC)6 | GACAACGGAAATGTGCCTGAG | TGGGTGGAGTTCCCTTTAGTTT | 57.5 |
| SR125 | (ACGC)9 | GCCGTCGCCAGTTCATTC | CTGCCTGACTCCAAGAGGAAATA | 59.5 |
| SR127 | (GTAT)5 | GGGAATGGACAGATTGGTTGA | GCTGACTGGTAACACGAAAGAAAA | 60.5 |
| SR129 | (ACGC)9 | GCCGTCGCCAGTTCATTC | CTGCCTGACTCCAAGAGGAAATA | 59.5 |
| SR130 | (AGAT)5 | CAGGTCCAGATGCCAAGC | GACAACAGAATACTACATTACACGG | 57.5 |
| SR131 | (AGAT)5 | GAACCCGCTCACTCTCTGAATGG | TCACCCAGACTTGGAAGCAAACTA | 59.5 |
Table 2 Information of 15 pairs of SSR primers used in this study
引物 Primer | 重复基元 Repetition type | 正向引物 Forward primer (5′-3′) | 反向引物 Reverse primer (5′-3′) | 退火温度Annealing temperature (℃) |
|---|---|---|---|---|
| SR57 | (GTTGG)5 | TGATGATTGGAGCGAGCGAAGT | GAGAAGCGAAAAAAAGGGAGGC | 57.5 |
| SR78 | (GTAG)5 | GGGTCCTTTACCTGACTCCTC | CACCCAATCGCAAACAGC | 56.5 |
| SR87 | (CAAT)5 | TCCCGCAAGGAAAAAGAG | CAGCACAAACGAAAAATAAAAATA | 51.0 |
| SR91 | (GAGCCT)5 | ATCGCCCGTGTCTCCTGTTTC | CGCAAGAAAACATCTCCACACAAGT | 57.5 |
| SR106 | (GGTT)7 | CAAAGTCGTGGGTCAGGTGTC | CCACAAGAACCAGCCAATACAAA | 57.5 |
| SR108 | (TGTA)10 | AGGCACAACTAATAGCAAGCA | CAATCGCTAACGCTGACG | 55.0 |
| SR112 | (GCCT)6 | GCAGCCGCCGACTACCTACT | AAACCACCGCGAAGACAACA | 59.5 |
| SR119 | (ATTT)5 | GGACCTGACCATCCATCTAAACT | TCGTTCTCGGTCGCTTTGT | 57.5 |
| SR120 | (CTAT)10 | CGGCTGCTCTTGGTTGATG | CGGTTAGGTGGGCTGGTTC | 60.5 |
| SR121 | (TGAC)6 | GACAACGGAAATGTGCCTGAG | TGGGTGGAGTTCCCTTTAGTTT | 57.5 |
| SR125 | (ACGC)9 | GCCGTCGCCAGTTCATTC | CTGCCTGACTCCAAGAGGAAATA | 59.5 |
| SR127 | (GTAT)5 | GGGAATGGACAGATTGGTTGA | GCTGACTGGTAACACGAAAGAAAA | 60.5 |
| SR129 | (ACGC)9 | GCCGTCGCCAGTTCATTC | CTGCCTGACTCCAAGAGGAAATA | 59.5 |
| SR130 | (AGAT)5 | CAGGTCCAGATGCCAAGC | GACAACAGAATACTACATTACACGG | 57.5 |
| SR131 | (AGAT)5 | GAACCCGCTCACTCTCTGAATGG | TCACCCAGACTTGGAAGCAAACTA | 59.5 |
| 位点Locus | Na | Ne | I | He | Ho | H | PIC |
|---|---|---|---|---|---|---|---|
| S57 | 6 | 4.643 | 1.637 | 0.790 | 0.963 | 0.785 | 0.752 |
| S78 | 14 | 7.194 | 2.214 | 0.866 | 1.000 | 0.861 | 0.847 |
| S87 | 8 | 4.231 | 1.628 | 0.775 | 0.857 | 0.764 | 0.728 |
| S91 | 7 | 3.399 | 1.446 | 0.710 | 0.945 | 0.706 | 0.662 |
| S106 | 9 | 3.941 | 1.570 | 0.750 | 0.937 | 0.746 | 0.705 |
| S108 | 12 | 6.132 | 2.050 | 0.843 | 0.932 | 0.837 | 0.819 |
| S112 | 7 | 2.372 | 1.124 | 0.582 | 0.759 | 0.578 | 0.530 |
| S119 | 6 | 2.673 | 1.186 | 0.634 | 0.550 | 0.626 | 0.557 |
| S120 | 12 | 6.863 | 2.139 | 0.860 | 0.938 | 0.854 | 0.839 |
| S121 | 11 | 7.392 | 2.115 | 0.873 | 0.981 | 0.865 | 0.850 |
| S125 | 9 | 6.472 | 1.990 | 0.850 | 0.816 | 0.846 | 0.827 |
| S127 | 11 | 5.372 | 1.944 | 0.820 | 0.945 | 0.814 | 0.793 |
| S129 | 9 | 5.098 | 1.772 | 0.808 | 0.780 | 0.804 | 0.776 |
| S130 | 7 | 4.726 | 1.712 | 0.796 | 0.944 | 0.788 | 0.759 |
| S131 | 19 | 10.752 | 2.590 | 0.914 | 0.887 | 0.907 | 0.900 |
| 平均Mean | 9.800 | 5.418 | 1.808 | 0.791 | 0.882 | 0.785 | 0.756 |
Table 3 Genetic diversity of 15 SSR locus in L. przevalskyi
| 位点Locus | Na | Ne | I | He | Ho | H | PIC |
|---|---|---|---|---|---|---|---|
| S57 | 6 | 4.643 | 1.637 | 0.790 | 0.963 | 0.785 | 0.752 |
| S78 | 14 | 7.194 | 2.214 | 0.866 | 1.000 | 0.861 | 0.847 |
| S87 | 8 | 4.231 | 1.628 | 0.775 | 0.857 | 0.764 | 0.728 |
| S91 | 7 | 3.399 | 1.446 | 0.710 | 0.945 | 0.706 | 0.662 |
| S106 | 9 | 3.941 | 1.570 | 0.750 | 0.937 | 0.746 | 0.705 |
| S108 | 12 | 6.132 | 2.050 | 0.843 | 0.932 | 0.837 | 0.819 |
| S112 | 7 | 2.372 | 1.124 | 0.582 | 0.759 | 0.578 | 0.530 |
| S119 | 6 | 2.673 | 1.186 | 0.634 | 0.550 | 0.626 | 0.557 |
| S120 | 12 | 6.863 | 2.139 | 0.860 | 0.938 | 0.854 | 0.839 |
| S121 | 11 | 7.392 | 2.115 | 0.873 | 0.981 | 0.865 | 0.850 |
| S125 | 9 | 6.472 | 1.990 | 0.850 | 0.816 | 0.846 | 0.827 |
| S127 | 11 | 5.372 | 1.944 | 0.820 | 0.945 | 0.814 | 0.793 |
| S129 | 9 | 5.098 | 1.772 | 0.808 | 0.780 | 0.804 | 0.776 |
| S130 | 7 | 4.726 | 1.712 | 0.796 | 0.944 | 0.788 | 0.759 |
| S131 | 19 | 10.752 | 2.590 | 0.914 | 0.887 | 0.907 | 0.900 |
| 平均Mean | 9.800 | 5.418 | 1.808 | 0.791 | 0.882 | 0.785 | 0.756 |
居群 Population | AP | P (%) | Na | Ne | I | H | He | Ho |
|---|---|---|---|---|---|---|---|---|
| POP1 | 15.00 | 100.00 | 3.267 | 2.916 | 1.065 | 0.785 | 0.791 | 0.844 |
| POP2 | 12.00 | 80.00 | 2.571 | 2.078 | 0.751 | 0.462 | 0.593 | 0.696 |
| POP3 | 13.00 | 86.67 | 3.214 | 2.738 | 0.990 | 0.564 | 0.721 | 0.829 |
| POP4 | 15.00 | 100.00 | 3.467 | 2.920 | 1.092 | 0.621 | 0.735 | 0.858 |
| POP5 | 14.00 | 93.33 | 3.357 | 2.863 | 1.049 | 0.595 | 0.728 | 0.857 |
| POP6 | 13.00 | 86.67 | 3.714 | 2.998 | 1.118 | 0.609 | 0.736 | 0.832 |
| POP7 | 15.00 | 100.00 | 4.133 | 3.525 | 1.272 | 0.681 | 0.816 | 0.900 |
| POP8 | 12.00 | 80.00 | 2.846 | 2.444 | 0.908 | 0.550 | 0.682 | 0.873 |
| POP9 | 13.00 | 86.67 | 3.133 | 2.556 | 0.920 | 0.519 | 0.602 | 0.764 |
| POP10 | 13.00 | 87.67 | 3.071 | 2.840 | 1.003 | 0.589 | 0.787 | 0.905 |
| POP11 | 12.00 | 80.00 | 2.917 | 2.628 | 0.990 | 0.605 | 0.697 | 1.000 |
| POP12 | 10.00 | 66.67 | 2.083 | 2.028 | 0.660 | 0.447 | 0.498 | 0.833 |
| POP13 | 13.00 | 86.67 | 3.462 | 2.875 | 1.092 | 0.624 | 0.715 | 0.969 |
| POP14 | 14.00 | 93.33 | 3.467 | 2.946 | 1.090 | 0.612 | 0.714 | 0.860 |
| POP15 | 14.00 | 93.33 | 3.267 | 2.647 | 0.980 | 0.560 | 0.683 | 0.818 |
| POP16 | 15.00 | 100.00 | 4.133 | 3.389 | 1.250 | 0.672 | 0.784 | 0.964 |
| POP17 | 15.00 | 100.00 | 3.400 | 2.937 | 1.094 | 0.634 | 0.827 | 0.953 |
| POP18 | 15.00 | 100.00 | 2.933 | 2.701 | 0.963 | 0.589 | 0.711 | 0.983 |
| POP19 | 14.00 | 93.33 | 4.643 | 3.677 | 1.358 | 0.701 | 0.783 | 0.904 |
| POP20 | 15.00 | 100.00 | 3.267 | 2.910 | 1.056 | 0.617 | 0.759 | 0.933 |
| POP21 | 13.00 | 86.67 | 2.929 | 2.321 | 0.880 | 0.521 | 0.657 | 0.750 |
| 平均Mean | 13.57 | 90.52 | 3.299 | 2.806 | 1.028 | 0.598 | 0.717 | 0.841 |
Table 4 Genetic diversity of 21 populations in L. przevalskyi
居群 Population | AP | P (%) | Na | Ne | I | H | He | Ho |
|---|---|---|---|---|---|---|---|---|
| POP1 | 15.00 | 100.00 | 3.267 | 2.916 | 1.065 | 0.785 | 0.791 | 0.844 |
| POP2 | 12.00 | 80.00 | 2.571 | 2.078 | 0.751 | 0.462 | 0.593 | 0.696 |
| POP3 | 13.00 | 86.67 | 3.214 | 2.738 | 0.990 | 0.564 | 0.721 | 0.829 |
| POP4 | 15.00 | 100.00 | 3.467 | 2.920 | 1.092 | 0.621 | 0.735 | 0.858 |
| POP5 | 14.00 | 93.33 | 3.357 | 2.863 | 1.049 | 0.595 | 0.728 | 0.857 |
| POP6 | 13.00 | 86.67 | 3.714 | 2.998 | 1.118 | 0.609 | 0.736 | 0.832 |
| POP7 | 15.00 | 100.00 | 4.133 | 3.525 | 1.272 | 0.681 | 0.816 | 0.900 |
| POP8 | 12.00 | 80.00 | 2.846 | 2.444 | 0.908 | 0.550 | 0.682 | 0.873 |
| POP9 | 13.00 | 86.67 | 3.133 | 2.556 | 0.920 | 0.519 | 0.602 | 0.764 |
| POP10 | 13.00 | 87.67 | 3.071 | 2.840 | 1.003 | 0.589 | 0.787 | 0.905 |
| POP11 | 12.00 | 80.00 | 2.917 | 2.628 | 0.990 | 0.605 | 0.697 | 1.000 |
| POP12 | 10.00 | 66.67 | 2.083 | 2.028 | 0.660 | 0.447 | 0.498 | 0.833 |
| POP13 | 13.00 | 86.67 | 3.462 | 2.875 | 1.092 | 0.624 | 0.715 | 0.969 |
| POP14 | 14.00 | 93.33 | 3.467 | 2.946 | 1.090 | 0.612 | 0.714 | 0.860 |
| POP15 | 14.00 | 93.33 | 3.267 | 2.647 | 0.980 | 0.560 | 0.683 | 0.818 |
| POP16 | 15.00 | 100.00 | 4.133 | 3.389 | 1.250 | 0.672 | 0.784 | 0.964 |
| POP17 | 15.00 | 100.00 | 3.400 | 2.937 | 1.094 | 0.634 | 0.827 | 0.953 |
| POP18 | 15.00 | 100.00 | 2.933 | 2.701 | 0.963 | 0.589 | 0.711 | 0.983 |
| POP19 | 14.00 | 93.33 | 4.643 | 3.677 | 1.358 | 0.701 | 0.783 | 0.904 |
| POP20 | 15.00 | 100.00 | 3.267 | 2.910 | 1.056 | 0.617 | 0.759 | 0.933 |
| POP21 | 13.00 | 86.67 | 2.929 | 2.321 | 0.880 | 0.521 | 0.657 | 0.750 |
| 平均Mean | 13.57 | 90.52 | 3.299 | 2.806 | 1.028 | 0.598 | 0.717 | 0.841 |
| 位点Locus | Fis | Fit | Fst | Nm |
|---|---|---|---|---|
| S57 | -0.548 | -0.203 | 0.223 | 0.873 |
| S78 | -0.401 | -0.159 | 0.172 | 1.199 |
| S87 | -0.592 | 0.314 | 0.569 | 0.189 |
| S91 | -0.609 | -0.324 | 0.177 | 1.161 |
| S106 | -0.504 | -0.240 | 0.176 | 1.174 |
| S108 | -0.435 | -0.101 | 0.233 | 0.822 |
| S112 | -0.564 | -0.294 | 0.173 | 1.199 |
| S119 | -0.588 | 0.490 | 0.679 | 0.118 |
| S120 | -0.431 | -0.008 | 0.295 | 0.596 |
| S121 | -0.501 | 0.005 | 0.337 | 0.492 |
| S125 | -0.354 | 0.089 | 0.327 | 0.513 |
| S127 | -0.422 | -0.094 | 0.231 | 0.833 |
| S129 | -0.228 | 0.093 | 0.261 | 0.707 |
| S130 | -0.745 | -0.026 | 0.412 | 0.356 |
| S131 | -0.396 | 0.063 | 0.329 | 0.510 |
| 均值±标准差Mean±SD | -0.488±0.033 | -0.026±0.057 | 0.306±0.038 | 0.716±0.094 |
Table 5 The genetic differentiation index of different populations in L. przevalskyi
| 位点Locus | Fis | Fit | Fst | Nm |
|---|---|---|---|---|
| S57 | -0.548 | -0.203 | 0.223 | 0.873 |
| S78 | -0.401 | -0.159 | 0.172 | 1.199 |
| S87 | -0.592 | 0.314 | 0.569 | 0.189 |
| S91 | -0.609 | -0.324 | 0.177 | 1.161 |
| S106 | -0.504 | -0.240 | 0.176 | 1.174 |
| S108 | -0.435 | -0.101 | 0.233 | 0.822 |
| S112 | -0.564 | -0.294 | 0.173 | 1.199 |
| S119 | -0.588 | 0.490 | 0.679 | 0.118 |
| S120 | -0.431 | -0.008 | 0.295 | 0.596 |
| S121 | -0.501 | 0.005 | 0.337 | 0.492 |
| S125 | -0.354 | 0.089 | 0.327 | 0.513 |
| S127 | -0.422 | -0.094 | 0.231 | 0.833 |
| S129 | -0.228 | 0.093 | 0.261 | 0.707 |
| S130 | -0.745 | -0.026 | 0.412 | 0.356 |
| S131 | -0.396 | 0.063 | 0.329 | 0.510 |
| 均值±标准差Mean±SD | -0.488±0.033 | -0.026±0.057 | 0.306±0.038 | 0.716±0.094 |
变异来源 Source of variance | 自由度 Degree of freedom | 离差平方和 Sum of squares of deviations | 方差分量 Mean square | 估计方差 Estimate variance | 总变异百分比 Percentage of total variance (%) |
|---|---|---|---|---|---|
| 居群间Among populations | 20 | 472.990 | 23.650 | 3.457 | 33 |
| 居群内Within populations | 80 | 562.633 | 7.033 | 7.033 | 67 |
| 总计Total | 100 | 1035.624 | - | 10.490 | 100 |
Table 6 Molecular variance analysis among and within L. przevalskyi populations
变异来源 Source of variance | 自由度 Degree of freedom | 离差平方和 Sum of squares of deviations | 方差分量 Mean square | 估计方差 Estimate variance | 总变异百分比 Percentage of total variance (%) |
|---|---|---|---|---|---|
| 居群间Among populations | 20 | 472.990 | 23.650 | 3.457 | 33 |
| 居群内Within populations | 80 | 562.633 | 7.033 | 7.033 | 67 |
| 总计Total | 100 | 1035.624 | - | 10.490 | 100 |
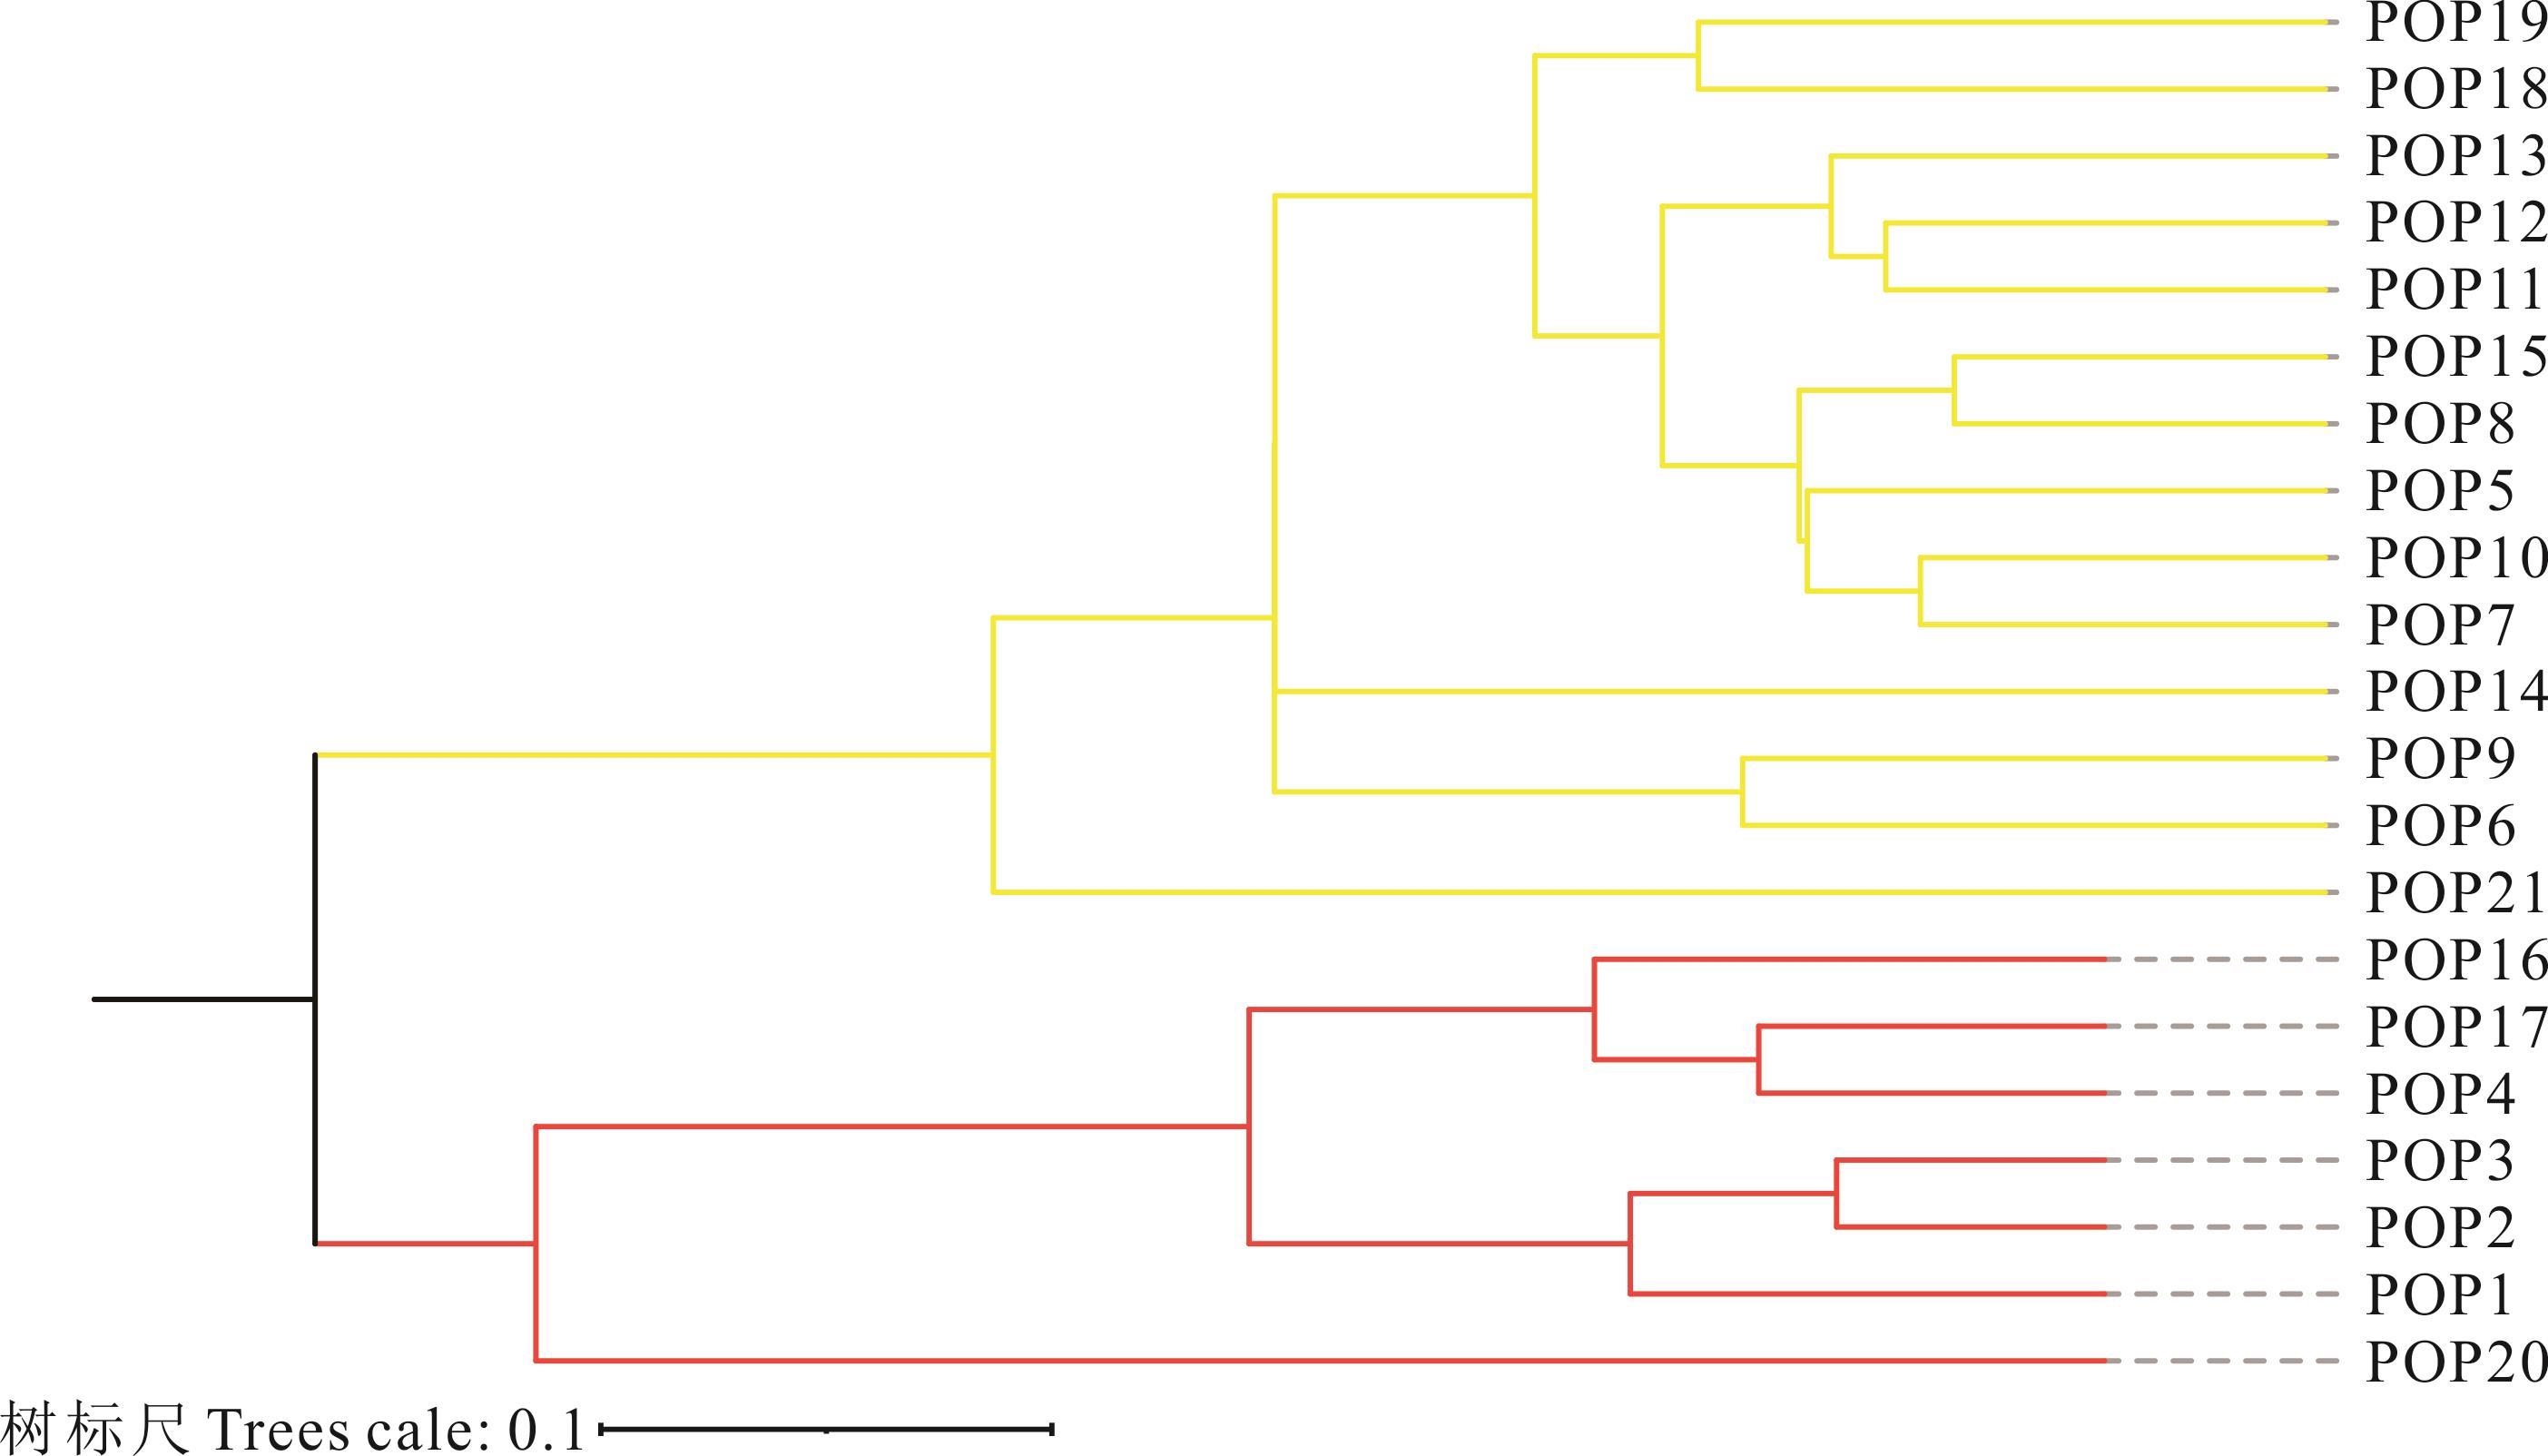
Fig.1 Unweighted pair group method with arithmetic average (UPGMA) dendrogram for 21 populations of L. przevalskyi
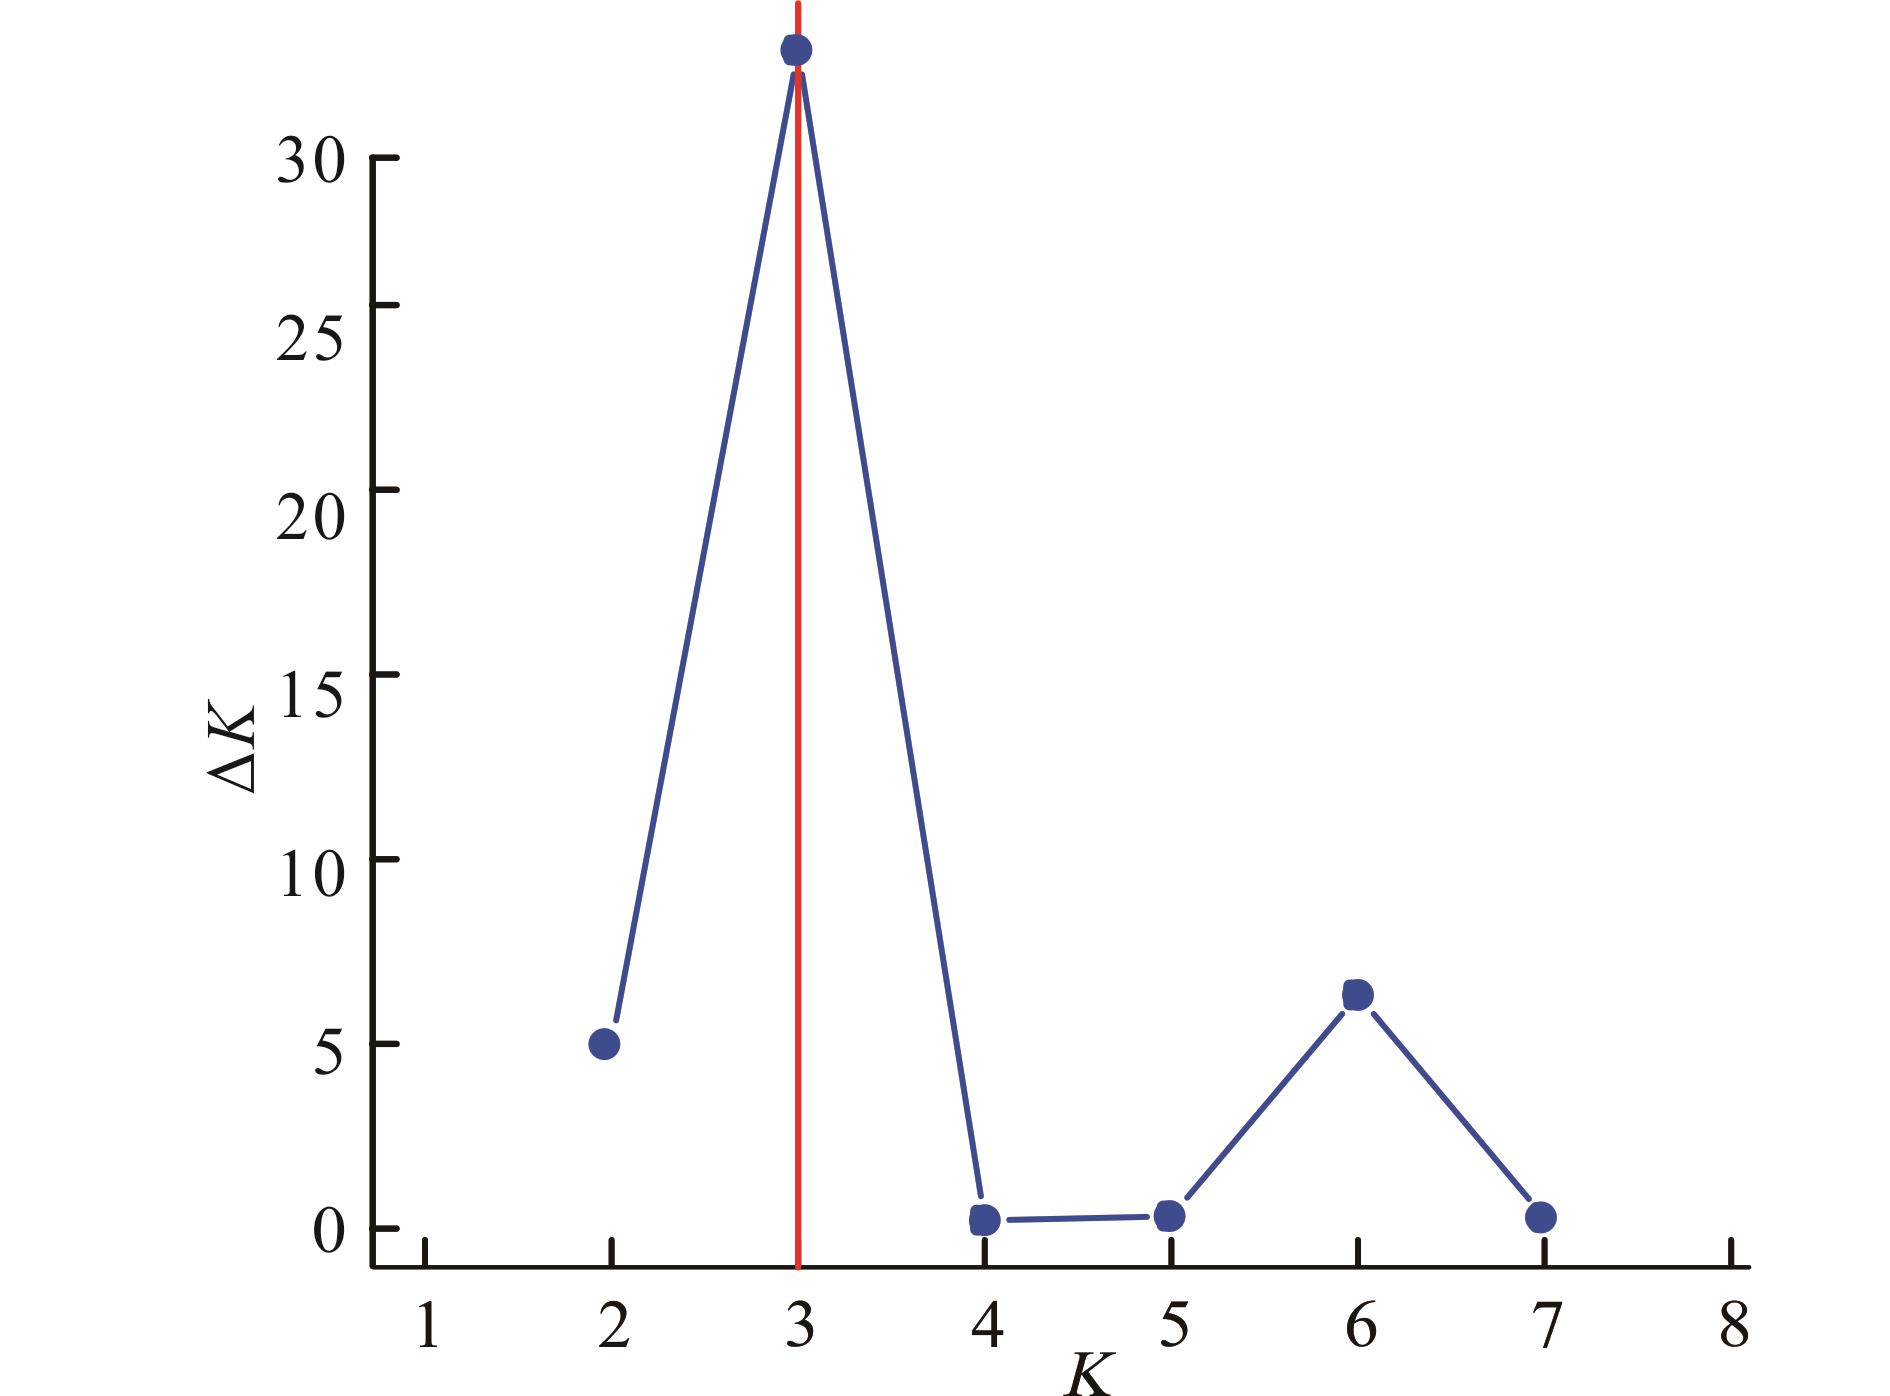
Fig.2 ΔK based on different numbers of STRUCTURE clusters
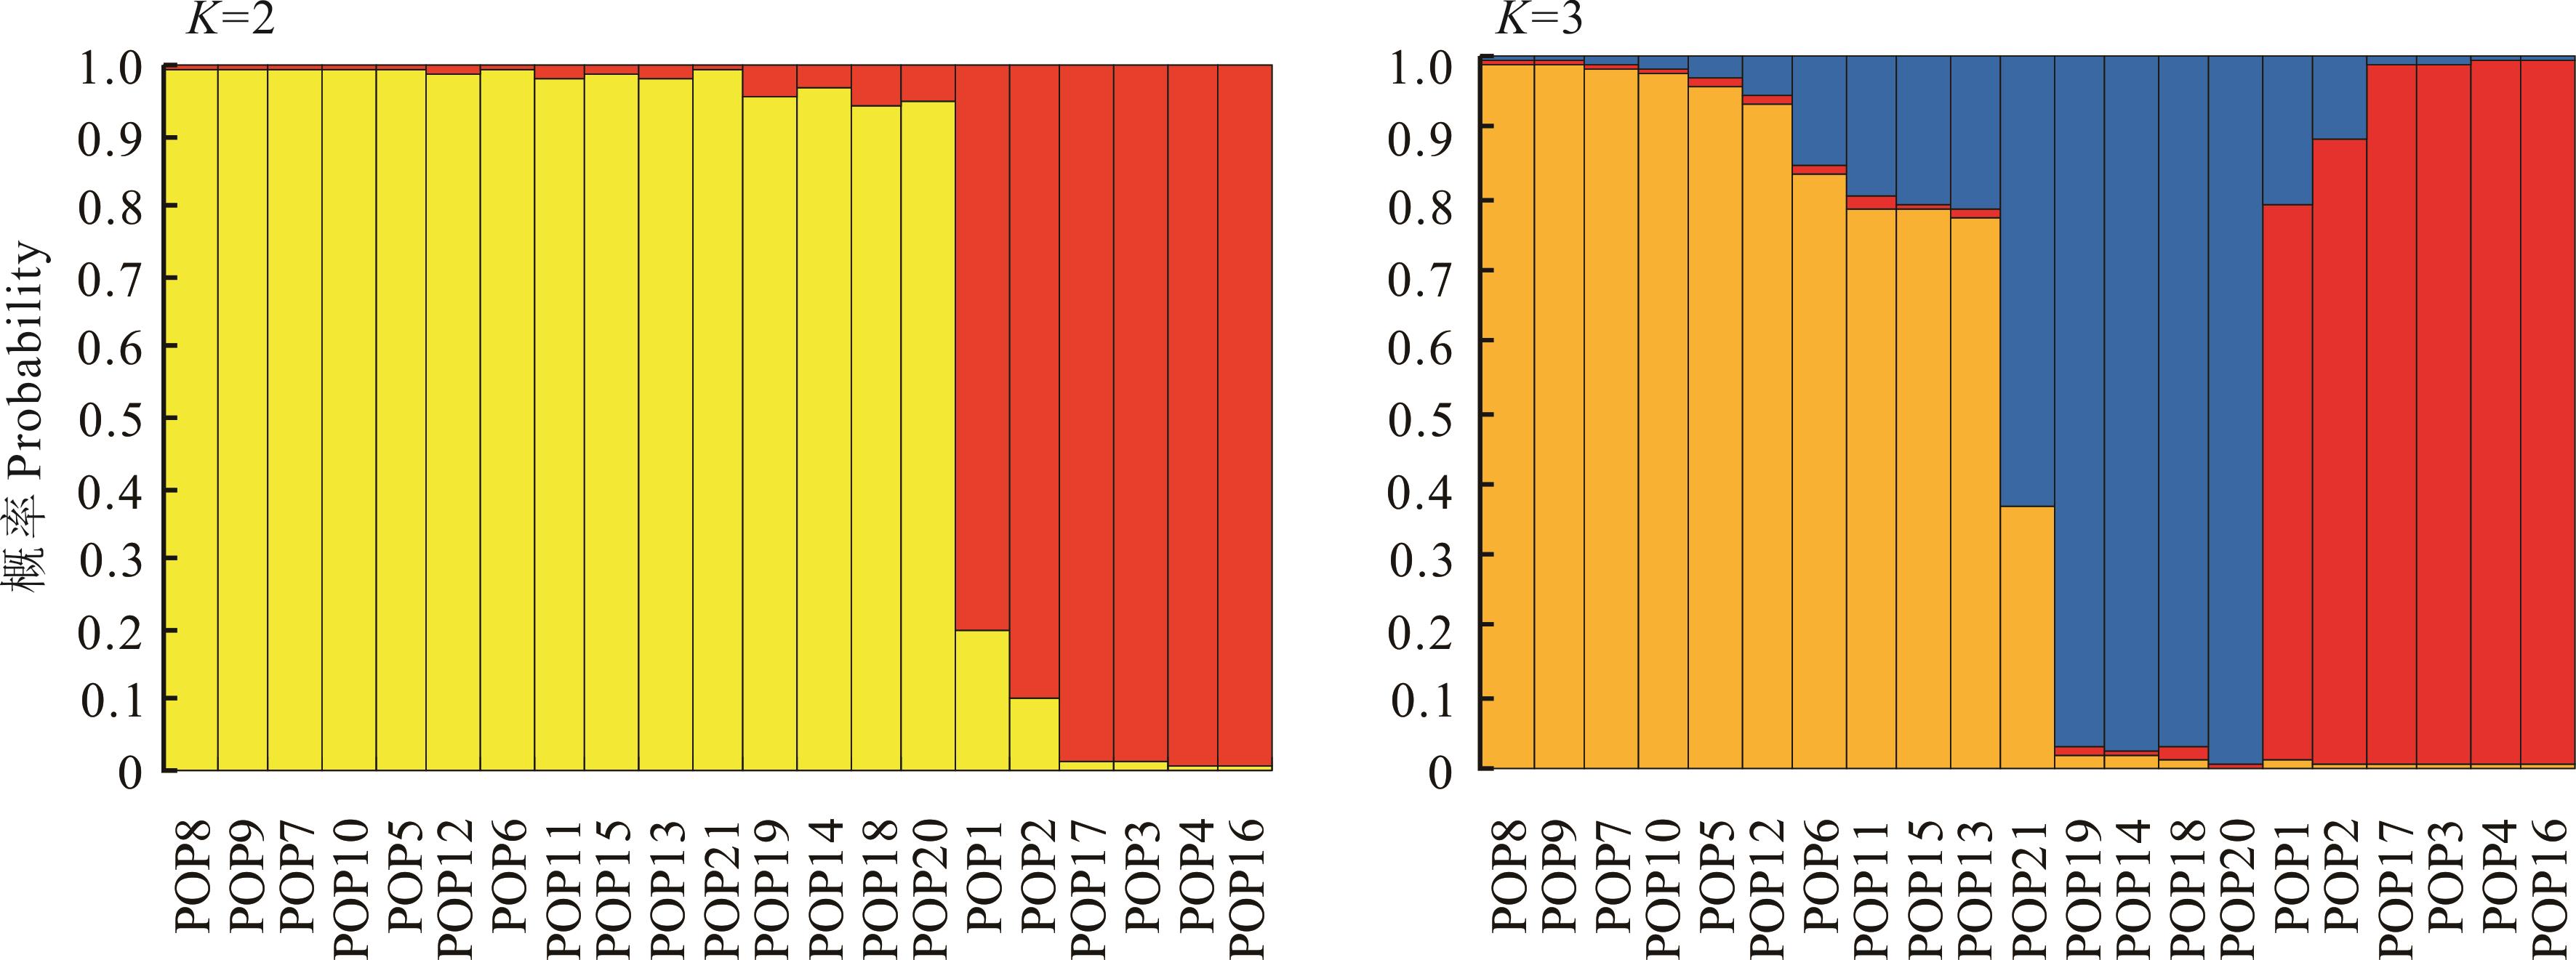
Fig.3 Analysis of genetic structure for 21 populations of L. przevalskyi
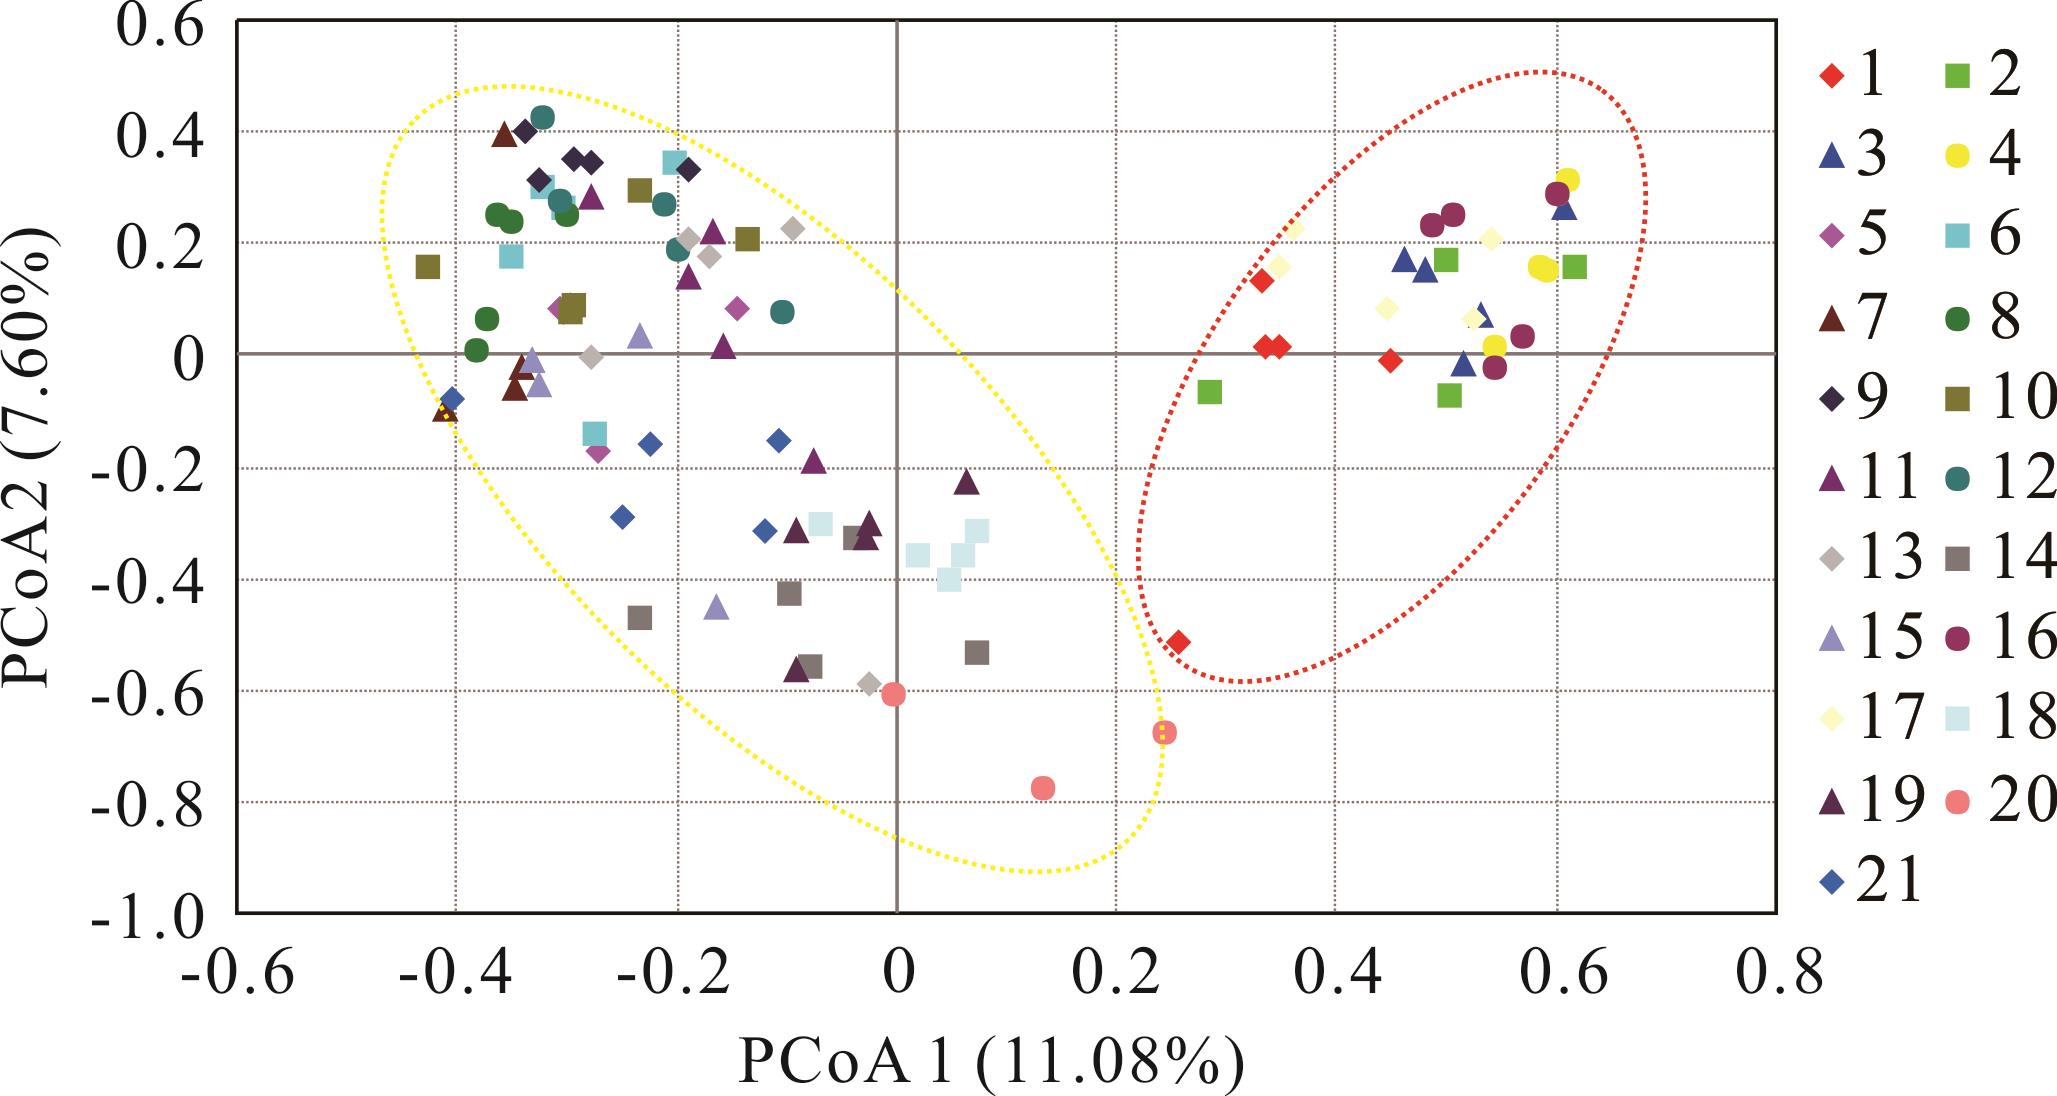
Fig.4 Principal coordinate analysis for 21 populations of L. przevalskyi
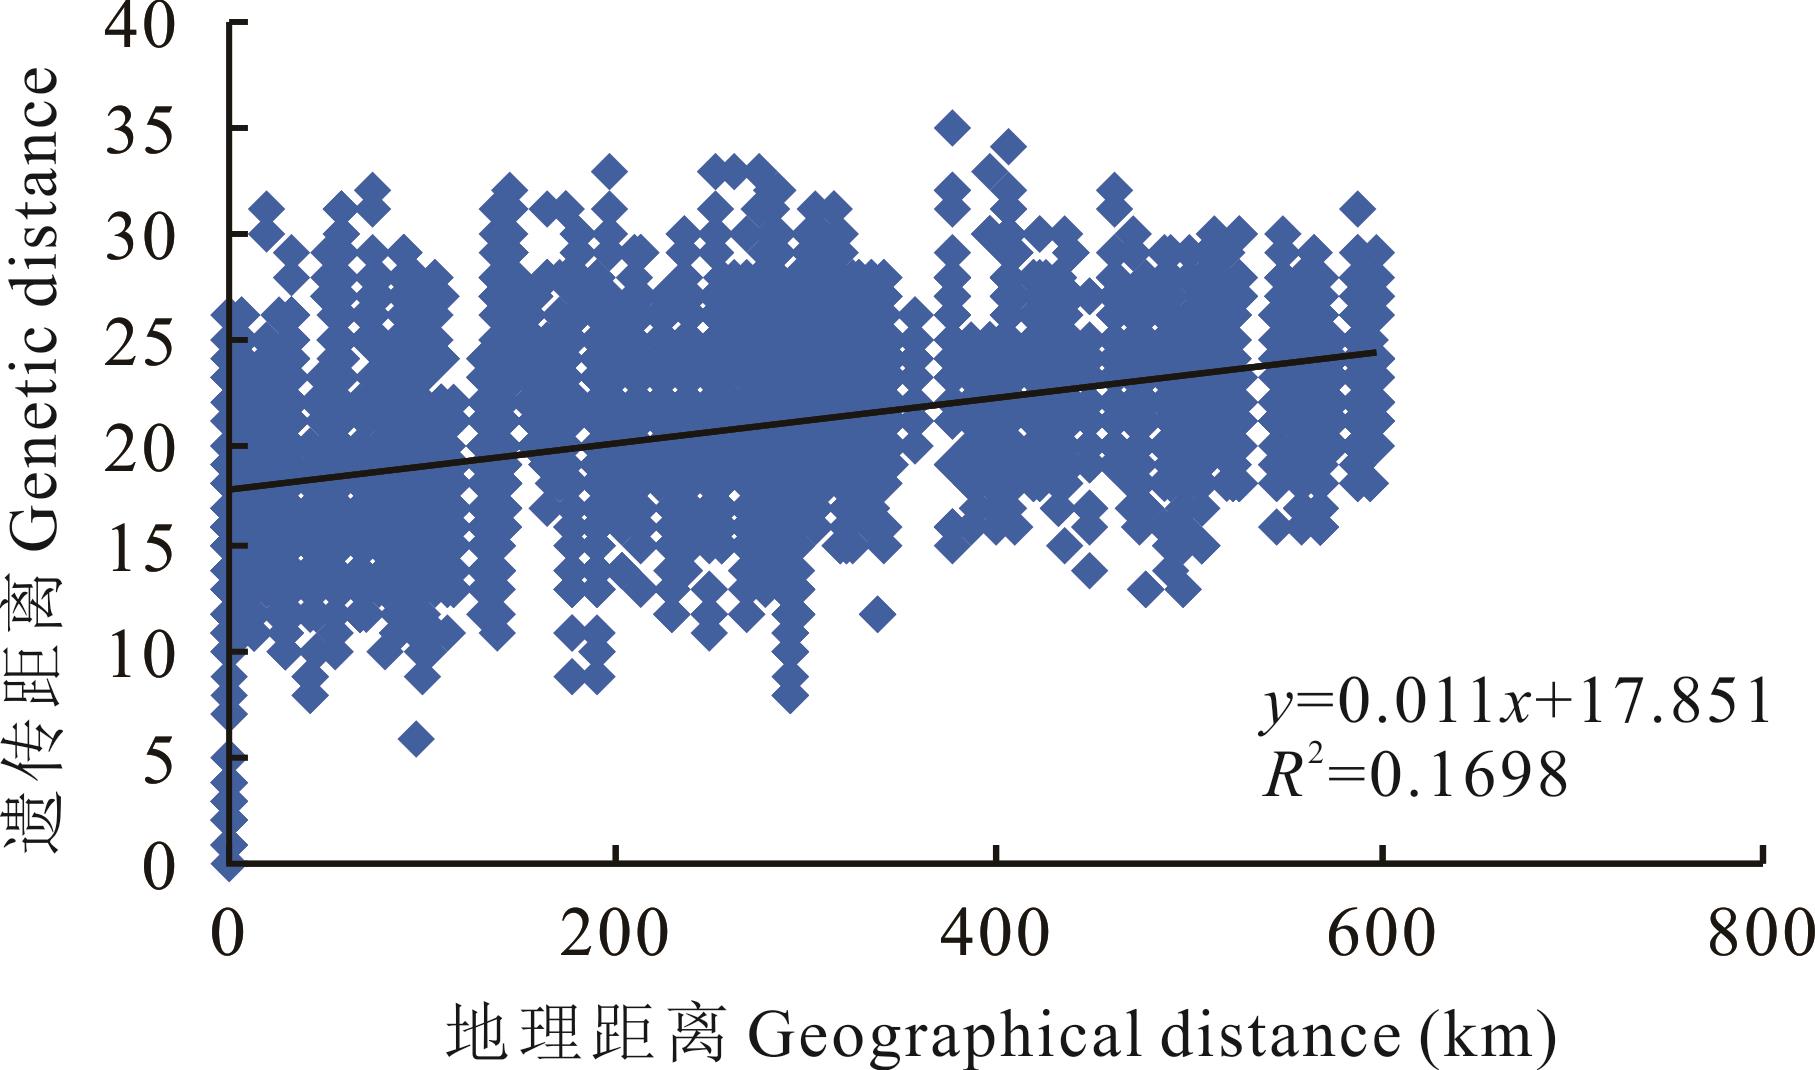
Fig.5 Mantel-test between geographical distance and genetic distance for 21 populations of L. przevalskyi
| [1] | Ren X F. Genetic diversity and population genetic structure analysis of bermudagrass [Cynodon dactylon (L.) Pers.] based on SSR markers. Luoyang: Henan University of Science and Technology, 2022. |
| 任学锋. 基于SSR标记的狗牙根遗传多样性及群体遗传结构分析. 洛阳: 河南科技大学, 2022. | |
| [2] | Wang H X, Hu Z A. Plant breeding system, genetic structure and conservation of genetic diversity. Biodiversity Science, 1996, 4(2): 92-96. |
| 王洪新, 胡志昂. 植物的繁育系统、遗传结构和遗传多样性保护. 生物多样性, 1996, 4(2): 92-96. | |
| [3] | Chen X D. Population genetics structure and phylogeography of Quercus fabri. Xi’an: Northwest University, 2018. |
| 陈晓丹. 白栎的群体遗传结构和谱系地理学研究. 西安: 西北大学, 2018. | |
| [4] | Guo Q, Xue X, Wang D D, et al. Genetic diversity and population genetic structure of Paeonia suffruticosa by chloroplast DNA simple sequence repeats (cpSSRs). Horticultural Plant Journal, 2025, 11(1): 367-376. |
| [5] | Li Y Y, Liu C N, Wang R, et al. Applications of molecular markers in conserving endangered species. Biodiversity Science, 2020, 28(3): 367-375. |
| 李媛媛, 刘超男, 王嵘, 等. 分子标记在濒危物种保护中的应用. 生物多样性, 2020, 28(3): 367-375. | |
| [6] | Liu Y, Wu B, Liu D C, et al. On genetic diversity of Jiangxi native citrus and its wild varieties based on SSR markers. Acta Agriculturae Universitatis Jiangxiensis, 2005, 27(4): 486-490. |
| 刘勇, 吴波, 刘德春, 等. 江西柑橘地方品种资源及野生近缘种SSR分子标记. 江西农业大学学报, 2005, 27(4): 486-490. | |
| [7] | Grover A, Sharma P C. Development and use of molecular markers: past and present. Critical Reviews in Biotechnology, 2016, 36(2): 290-302. |
| [8] | Jena R C, Chand P K. Multiple DNA marker assisted diversity analysis of Indian mango (Mangifera indica L.) populations. Scientific Reports, 2021, 11: 10345. |
| [9] | Yan R J, Schnabel K E, Rowden A A, et al. Population structure and genetic connectivity of squat lobsters (Munida Leach, 1820) associated with vulnerable marine ecosystems in the southwest Pacific Ocean. Frontiers in Marine Science, 2020, 6: 791. |
| [10] | Dang M, Zhou H J, Woeste K E, et al. Comparative phylogeography of Juglans regia and J. mandshurica combining organellar and nuclear DNA markers to assess genetic diversity and introgression in regions of sympatry. Trees, 2021, 35: 1993-2007. |
| [11] | Gao C C, Yan L P, Wu D J, et al. Analysis of the genetic diversity and population structure of Fraxinus spp. populations based on SSR markers. Journal of Central South University of Forestry & Technology, 2023, 43(6): 69-78. |
| 高铖铖, 燕丽萍, 吴德军, 等. 基于SSR标记的白蜡群体遗传多样性和群体结构分析. 中南林业科技大学学报, 2023, 43(6): 69-78. | |
| [12] | Liu L, Guo B Z. Flora of China (volume 9 book 2). Beijing: Science Press, 2002: 377-380. |
| 刘亮, 郭本兆. 中国植物志(第九卷 第二册). 北京: 科学出版社, 2002: 377-380. | |
| [13] | Lyu T, Liu Y P, Zhou Y H, et al. Germplasm collection and taxonomic review of Littledalea (Poaceae) in the Qinghai-Tibet Plateau. Hubei Agricultural Sciences, 2018, 57(22): 11-13. |
| 吕婷, 刘玉萍, 周勇辉, 等. 青藏高原扇穗茅属的分类现状及种质资源收集. 湖北农业科学, 2018, 57(22): 11-13. | |
| [14] | Hooker J D. Flora of British India. London: L. Reeve & Co, 1897: 2472-2473. |
| [15] | Tzvelev N N. Planta Asiae Centralium. Aedibus: Nauka, 1968: 173-174. |
| [16] | Wu Z Y. Flora of Xizang (volume 5). Beijing: Science Press, 1987: 138-139. |
| 吴征镒. 西藏植物志(第五卷). 北京: 科学出版社, 1987: 138-139. | |
| [17] | Lu S L. Littledalea, flora of Qinghai (volume 4). Xining: Qinghai People’s Publishing House, 1999: 72-74. |
| 卢生莲. 扇穗茅属,青海植物志(第四卷). 西宁: 青海人民出版社, 1999: 72-74. | |
| [18] | Zhou Y H. Species delimitation of Littledalea (Poaceae), an endemic genus from the Qinghai-Tibet Plateau. Xining: Qinghai Normal University, 2017. |
| 周勇辉. 青藏高原特有属-扇穗茅属的物种界定研究. 西宁: 青海师范大学, 2017. | |
| [19] | Liu Y P, Lyu T, Zhu D, et al. Sequencing and alignment analysis of the complete chloroplast genome of Littledalea tibetica, an endemic species from the Qinghai-Tibet Plateau. Bulletin of Botanical Research, 2018, 38(4): 518-525. |
| 刘玉萍, 吕婷, 朱迪, 等. 青藏高原特有种——藏扇穗茅叶绿体基因组测序及序列分析. 植物研究, 2018, 38(4): 518-525. | |
| [20] | Liu T, Liu Y P, Lyu T, et al. Potential distribution of Littledalea, an endemic genus from the Qinghai-Tibet Plateau, predicted by Biomod 2 models. Acta Agrestia Sinica, 2020, 28(6): 1650-1656. |
| 刘涛, 刘玉萍, 吕婷, 等. 基于Biomod 2组合模型预测青藏高原特有属扇穗茅属物种的潜在分布. 草地学报, 2020, 28(6): 1650-1656. | |
| [21] | Yang P, Su X, Liu Y P, et al. Chromosome number and karyotype analysis from different populations of Littledalea racemosa. Acta Agrestia Sinica, 2022, 30(7): 1712-1720. |
| 杨萍, 苏旭, 刘玉萍, 等. 扇穗茅不同居群染色体数目及核型分析. 草地学报, 2022, 30(7): 1712-1720. | |
| [22] | Peakall R, Smouse P E. GenAlEx 6.5: genetic analysis in Excel. Population genetic software for teaching and research-an update. Bioinformatics, 2012, 28(19): 2537-2539. |
| [23] | Fu G, Liu Y P, Su X, et al. Analysis of SSR characterization in full-length transcriptome and development of SSR molecular markers for Littledalea racemosa. Acta Prataculturae Sinica, 2025, 34(7): 107-119. |
| 富贵, 刘玉萍, 苏旭, 等. 扇穗茅全长转录组SSR特征分析及分子标记开发. 草业学报, 2025, 34(7): 107-119. | |
| [24] | Porebski S, Bailey L G, Baum B R. Modification of a CTAB DNA extraction protocol for plants containing high polysaccharide and polyphenol components. Plant Molecular Biology Reporter, 1997, 15(1): 8-15. |
| [25] | Yeh F C, Yang R C, Boyle T, et al. POPGENE Version 1.32 Microsoft windows-based freeware for populations genetic analysis Version 1.31. Edmonton: Molecular Biology and Biotechnology Centre, University of Alberta, 1999. |
| [26] | Kalinowski S T, Taper M L, Marshall T C. Revising how the computer program CERVUS accommodates genotyping error increases success in paternity assignment. Molecular Ecology, 2007, 16(5): 1099-1106. |
| [27] | Nei M F, Tajima F, Tateno Y. Accuracy of estimated phylogenetic trees from molecular data. Ⅱ. Gene frequency data. Journal of Molecular Evolution, 1982, 19(2): 153-170. |
| [28] | Hubisz M J, Falush D, Stephens M, et al. Inferring weak population structure with the assistance of sample group information. Molecular Ecology Resources, 2009, 9(5): 1322-1332. |
| [29] | Evanno G, Regnaut S, Goudet J. Detecting the number of clusters of individuals using the software structure: a simulation study. Molecular Ecology, 2005, 14(8): 2611-2620. |
| [30] | Jiang L Y, Wu W L, Zhang K K, et al. Transeriptome sequencing and development of SSR molecular markers of Taxus chinensis var. mairei. Chinese Traditional and Herbal Drugs, 2024, 55(3): 928-935. |
| 蒋路园, 吴文丽, 张恺恺, 等. 南方红豆杉转录组SSR位点分析及其分子标记开发. 中草药, 2024, 55(3): 928-935. | |
| [31] | Gao T X, Cai Y L, Feng Y, et al. Genetic diversity and genetic structure of Prunus pseudocerasus populations from China as revealed by SSR markers. Acta Horticulturae Sinica, 2016, 43(6): 1148-1156. |
| 高天翔, 蔡宇良, 冯瑛, 等. 中国樱桃14个自然居群遗传多样性和遗传结构的SSR评价. 园艺学报, 2016, 43(6): 1148-1156. | |
| [32] | Liu Z L, Wan S L, Yan C P, et al. Genetic diversity of Jinsha pomelo and its closely related germplasm assessed by SSR molecular markers. South China Fruits, 2017, 46(3): 1-4. |
| 刘召亮, 万水林, 闫承璞, 等. 金沙柚及其近缘种质基于SSR分子标记的遗传多样性分析. 中国南方果树, 2017, 46(3): 1-4. | |
| [33] | Sun L J,He J J,Wang J C, et al. Development of SSR markers based on full-length transcriptome sequencing and genetic diversity analysis of Halogeton glomeratus. Acta Prataculturae Sinica, 2022, 31(8): 199-210. |
| 孙禄娟, 何建军, 汪军成, 等. 基于全长转录组测序的盐生草SSR标记开发及其遗传多样性分析. 草业学报, 2022, 31(8): 199-210. | |
| [34] | Peng Y L, Zhou Q P, Chen S Y, et al. Genetic diversity of Elymus nutans germplasm resources from the Qinghai-Tibet Plateau in China detected by SSR markers. Pratacultural Science, 2018, 35(5): 1080-1089. |
| 彭语洛, 周青平, 陈仕勇, 等. 青藏高原垂穗披碱草种质资源遗传多样性的SSR分析. 草业科学, 2018, 35(5): 1080-1089. | |
| [35] | Liang R F. Genetic structure and physiology of drought resistance in the population of Psammochloa villosa. Xining: Qinghai Normal University, 2021. |
| 梁瑞芳. 沙鞭群体遗传结构及抗旱生理研究. 西宁: 青海师范大学, 2021. | |
| [36] | Weir B S, Cockerham C C. Estimating F-statistics for the analysis of population structure. Evolution, 1984, 38(6): 1358-1370. |
| [37] | Wang Y L. Genetics diversity and molecular phylogeography of Clintonia udensis. Xi’an: Northwest University, 2006. |
| 王祎玲. 七筋菇植物遗传多样性与分子系统地理学研究. 西安: 西北大学, 2006. | |
| [38] | Sun X. Studies on genetic diversity of Aselliscus stoliczkanus. Xinxiang: Henan Normal University, 2013. |
| 孙晓. 三叶蹄蝠遗传多样性研究. 新乡: 河南师范大学, 2013. | |
| [39] | Liu S T, Yi X R, Zhou M W, et al. Analysis of genetic diversity and population structure of pear germplasm resources in Guangxi. Journal of Fruit Science, 2024, 41(3): 379-391. |
| 刘珊廷, 易显荣, 周民武, 等. 广西梨种质资源遗传多样性和群体结构分析. 果树学报, 2024, 41(3): 379-391. | |
| [40] | Zhao L. Assessment of genetic diversity and population genetic structure in Chinese Stipa breviflora using SSR markers. Hohhot: Inner Mongolia University, 2015. |
| 赵磊. 基于SSR标记的短花针茅种群遗传多样性与遗传结构分析. 呼和浩特: 内蒙古大学, 2015. | |
| [41] | Zeng L S, Zhang C C, Zhang J, et al. Genetic diversity analysis of perennial ryegrass germplasm by SSR molecular markers. Pratacultural Science, 2022, 39(1): 75-84. |
| 曾令霜, 张晨晨, 张敬, 等. 多年生黑麦草种质SSR分子标记遗传多样性分析. 草业科学, 2022, 39(1): 75-84. | |
| [42] | Yang J. Study on the genetic diversity of 28 Agropyron cristatum germplasm resources in Inner Mongolia. Hohhot: Inner Mongolia Agricultural University, 2023. |
| 杨靖. 内蒙古28份冰草种质资源材料遗传多样性的研究. 呼和浩特: 内蒙古农业大学, 2023. | |
| [43] | Li Q. Study on the bioecological characters and genetics diversity of Japanese brome in wheat field. Tai’an: Shandong Agricultural University, 2017. |
| 李琦. 麦田雀麦生物生态学特性与遗传多样性研究. 泰安: 山东农业大学, 2017. | |
| [44] | Nybom H, Bartish I V. Effective of life history traits and sampling strategies on genetic diversity estimates obtained with RAPD markers in plants. Perspectives in Plant Ecology, Evolution and Systematic, 2000, 3(2): 93-114. |
| [45] | Liu Y C, Liu C, Yang Y M, et al. Genetic structure analysis of the cultivated blueberry (Vaccinium spp.) species and wild species in China based on EST-SSR markers. Journal of Fruit Science, 2017, 34(8): 956-967. |
| 刘有春, 刘成, 杨艳敏, 等. 基于EST-SSR标记的越橘栽培种和几个中国野生种的遗传结构分析. 果树学报, 2017, 34(8): 956-967. | |
| [46] | Degirmenci F O, Acar P, Kaya Z. Consequences of habitat fragmentation on genetic diversity and structure of Salix alba L. populations in two major river systems of Turkey. Tree Genetics and Genomes, 2019, 15(4): 1-13. |
| [47] | Jones A G, ArdrenW R. Methods of parentage analysis in natural populations. Molecular Ecology, 2003, 12(10): 2511-2523. |
| [48] | Hickerson M J, Carstens B C, Cavender-Bares J, et al. Phylogeography’s past, present, and future: 10 years after Avise, 2010. Molecular Phylogenetics and Evolution, 2010, 54(1): 291-301. |
| [49] | Qiu Y X, Fu C X, Comes H P. Plant molecular phylogeography in China and adjacent regions: Tracing the genetic imprints of Quaternary climate and environmental change in the world’s most diverse temperate flora. Molecular Phylogenetics and Evolution, 2011, 59(1): 225-244. |
| [50] | Liu J Q, Sun Y S, Ge X J, et al. Phylogeographic studies of plants in China: Advances in the past and directions in the future. Journal of Systematics and Evolution, 2012, 50(4): 267-275. |
| [1] | Xian-fang ZHANG, Gang NIE, Si-yuan HUANG, Shuai YU, Su-tian ZUO, Xin-quan ZHANG. Identification of hybrids and analysis of phenotypic variation in the F1 generation of Pennisetum purpureum based on SSR markers [J]. Acta Prataculturae Sinica, 2025, 34(11): 114-124. |
| [2] | Yi-nan JI, Xue-feng REN, Tian-tian GOU, Guo-zhang ZANG, Yi-qi ZHENG. A study of genetic diversity in centipedegrass populations in Henan based on SSR markers [J]. Acta Prataculturae Sinica, 2023, 32(9): 198-212. |
| [3] | Yu-qi ZHE, Zhi-juan WU, Ji-kun WANG, Jin-cheng ZHONG, Zhi-xin CHAI, Jin-wei XIN. Analysis of the genetic structure of Tibetan yak populations based on mtDNA COX3 [J]. Acta Prataculturae Sinica, 2023, 32(9): 231-240. |
| [4] | Zi-li LYU, Bin LIU, Feng CHANG, Zi-jing MA, Qiu-mei CAO. Species diversity and phylogenetic diversity in Bayinbrook alpine grasslands: elevation gradient distribution patterns and drivers [J]. Acta Prataculturae Sinica, 2023, 32(7): 12-22. |
| [5] | Shi-long MA, Xiao-wei LI, Xiang LI, Shu-qiong XIE, Yi-li LIU, Jiao TANG, Ming-feng JIANG. Assessment of genetic structure of 3 Maiwa yak preserved populations based on genotyping-by-sequencing technology [J]. Acta Prataculturae Sinica, 2022, 31(9): 183-194. |
| [6] | Xue-feng REN, Ya-bo DENG, Guo-zhang ZANG, Yi-qi ZHENG. A SSR marker analysis of genetic diversity and population genetic structure of bermudagrass in Henan Province [J]. Acta Prataculturae Sinica, 2022, 31(3): 60-70. |
| [7] | Jing PAN, Jun-chao ZHANG, You-jun CHEN, Qing-ping ZHOU. Genetic diversity analysis and fingerprint construction of Elymus germplasm based on SCoT markers [J]. Acta Prataculturae Sinica, 2022, 31(11): 48-60. |
| [8] | Li-fang CHANG, Xin LI, Hui-juan GUO, Lin-yi QIAO, Shu-wei ZHANG, Fang CHEN, Zhi-jian CHANG, Xiao-jun ZHANG. Genetic diversity analysis and comprehensive evaluation of octoploid Tritipyrum-derived wheat breeding lines based on agronomic traits [J]. Acta Prataculturae Sinica, 2022, 31(11): 61-74. |
| [9] | Xiao-fan YIN, Na WEI, Shu-wen ZHENG, Wen-xian LIU. Genome-wide development and utilization of LTR retrotransposon-based IRAP markers in Medicago truncatula [J]. Acta Prataculturae Sinica, 2022, 31(1): 131-144. |
| [10] | Jin LI, Shi-yong CHEN, Xu ZHAO, Hao-qi TIAN, Zhi-hua CHEN, Qing-ping ZHOU. Analysis of genetic structure and fingerprinting in oat varieties based on SCoT markers [J]. Acta Prataculturae Sinica, 2021, 30(7): 72-81. |
| [11] | Hui JI, Jiu-qiang GUAN, Hui WANG, Jian-xu ZHOU, Nong-ga A, Zong-wei HE, Zhen-xiang FAN, Long-kang QIU, Shi-xiao CAO, Tian-wu AN, Qin BAI, Jin-cheng ZHONG, Xiao-lin LUO. Genetic structure and diversity of Yading yak and Larima yak populations [J]. Acta Prataculturae Sinica, 2021, 30(5): 134-145. |
| [12] | Zheng-yu YANG, Zhong-jie LU, Mao ZHANG, Rui DONG. A digital image analysis of seed phenotypic traits of 132 Lespedeza accessions [J]. Acta Prataculturae Sinica, 2021, 30(11): 87-97. |
| [13] | Cong-cong LI, Ya-xing ZHOU, Qiang GU, Ming-xin YANG, Chuan-lu ZHU, Zi-yuan PENG, Kai XUE, Xin-quan ZHAO, Yan-fen WANG, Bao-ming JI, Jing ZHANG. The species diversity and community assembly of arbuscular mycorrhizal fungi in typical alpine grassland in Sanjiangyuan region [J]. Acta Prataculturae Sinica, 2021, 30(1): 46-58. |
| [14] | LEI Xiong, YOU Ming-hong, BAI Shi-qie, CHEN Li-li, DENG Pei-hua, XIONG Yi, XIONG Yan-li, YU Qing-qing, MA Xiao, YANG Jian, ZHANG Chang-bing. Genetic diversity analysis and multivariate evaluation of agronomic traits of 50 oat germplasm lines in northwest Sichuan [J]. Acta Prataculturae Sinica, 2020, 29(7): 131-142. |
| [15] | DING Yong-fu, WANG Ji-liang, CHEN Fen-qi, ZHUANG Ze-long, BAI Ming-xing, LU Yan-tian, JIN Bing-bing, PENG Yun-ling. Correlation between SSR diversity and ear traits of maize inbred lines [J]. Acta Prataculturae Sinica, 2020, 29(7): 143-153. |
| Viewed | ||||||
|
Full text |
|
|||||
|
Abstract |
|
|||||