

ISSN 1004-5759 CN 62-1105/S
草业学报 ›› 2022, Vol. 31 ›› Issue (11): 1-14.DOI: 10.11686/cyxb2022059
李颖( ), 吴静(), 李纯斌, 秦格霞
收稿日期:2022-02-14
修回日期:2022-03-14
出版日期:2022-11-20
发布日期:2022-10-01
通讯作者:
吴静
作者简介:E-mail: wujing@gsau.edu.cn基金资助:
Ying LI(), Jing WU(), Chun-bin LI, Ge-xia QIN
Received:2022-02-14
Revised:2022-03-14
Online:2022-11-20
Published:2022-10-01
Contact:
Jing WU
摘要:
根据青藏高原7个站点实测数据,计算站点地表层土壤热通量(G0)并分析站点的日、季变化特征;结合MODIS数据、中国西部1 km全天候地表温度数据集和中国区域地面气象要素驱动数据集,用Ma模型反演2003-2018年青藏高原地表土壤热通量,并且分析不同草地类型的G0变化。结果表明:1)站点地表层土壤热通量G0比不同深度的土壤热通量值大。G0的日变化曲线呈倒“U”形状,在夜晚相较于白天变化较为平缓。2)站点地表层土壤热通量G0的季节振幅变化呈现夏>春>秋>冬,春夏季G0均值整体为正值,秋冬季G0均值基本为负值。夏季高原西北地区的地表层土壤热通量相对于东南地区的较高,而冬季则相反。3)高原草地的土壤热通量值为40~80 W·m-2,16年各类草地G0平均值最高的是温性草原化荒漠类(76.557 W·m-2),最低的是高寒草甸类(46.118 W·m-2)。4)高原草地的G0一年内呈现出先增后降的变化趋势。高原各类草地G0的季节变化呈现夏>春>秋>冬,夏春季G0最低的均为高寒草甸类,较高的分别是温性草原化荒漠类和温性草原类;秋冬季G0最高的均为暖性灌草丛类,最低的均为高寒荒漠类。以上结果可为高原草地地表能量平衡研究提供一定参考依据。
李颖, 吴静, 李纯斌, 秦格霞. 2003-2018年青藏高原草地的地表层土壤热通量时空变化[J]. 草业学报, 2022, 31(11): 1-14.
Ying LI, Jing WU, Chun-bin LI, Ge-xia QIN. Temporal and spatial variation in grassland ground surface soil heat flux on the Qinghai-Tibetan Plateau from 2003 to 2018[J]. Acta Prataculturae Sinica, 2022, 31(11): 1-14.

图1 青藏高原草地类型及观测点分布
Fig.1 Grassland types and distribution of observation points on the Qinghai Tibet Plateau
站点名 Site name | 位置(经度/纬度/海拔) Location (longitude/ latitude/altitude) | 下垫面 Underlying surface | 观测项目 Observation item | 时间分辨率Temporal resolution (min) | 观测无效时段 Observation invalid period (年-月-日Year-month-day) |
|---|---|---|---|---|---|
大沙龙站 Dashalong station (DSL) | 98.9406° E 38.8399° N 3739 m | 沼泽类 Swamp | 降水量 Precipitation | 10 | 2015-9-13 |
| 土壤热通量 Soil heat flux | |||||
| 土壤温度 Soil temperature | |||||
| 土壤水分 Soil moisture | |||||
阿柔站 Arou station (AR) | 100.4643° E 38.0473° N 3033 m | 高寒草甸类 Alpine meadow | 降水量 Precipitation | 10 | 2015-7-31, 2015-8-4-2015-8-5, 2015-8-9-2015-8-16, 2015-8-18-2015-8-27, 2015-8-31-2015-9-20, 2015-9-30-2015-10-20 |
| 土壤热通量 Soil heat flux | |||||
| 土壤温度 Soil temperature | |||||
| 土壤水分 Soil moisture | |||||
峨堡站 Ebao station (EB) | 100.9151° E 37.9492° N 3294 m | 高寒草甸类 Alpine meadow | 降水量 Precipitation | 10 | 2015-11-1-2015-11-5 |
| 土壤热通量 Soil heat flux | |||||
| 土壤温度 Soil temperature | |||||
| 土壤水分 Soil moisture | |||||
景阳岭站 Jingyangling station (JYL) | 101.1160° E 37.8384° N 3750 m | 高寒草甸类 Alpine meadow | 降水量 Precipitation | 10 | |
| 土壤热通量 Soil heat flux | |||||
| 土壤温度 Soil temperature | |||||
| 土壤水分 Soil moisture | |||||
西大滩站 Xidatan station (XDT) | 94.1170° E 35.7170° N 4538 m | 高寒草原类 Alpine grassland | 降水量 Precipitation | 30 | |
| 土壤热通量 Soil heat flux | |||||
| 土壤温度 Soil temperature | |||||
| 土壤含水量 Soil moisture content | |||||
| 向上长波辐射 Upward long wave radiation | |||||
| 向下长波辐射 Downward long wave radiation | |||||
唐古拉站 Tanggula station (TGL) | 91.9330° E 33.0670° N 5110 m | 高寒草甸类 Alpine meadow | 降水量 Precipitation | 30 | |
| 土壤热通量 Soil heat flux | |||||
| 土壤温度 Soil temperature | |||||
| 土壤含水量 Soil moisture content | |||||
| 向上长波辐射 Upward long wave radiation | |||||
| 向下长波辐射 Downward long wave radiation | |||||
垭口站 Yakou station (YK) | 100.2421° E 38.0142° N 4148 m | 高寒草甸类 Alpine meadow | 降水量 Precipitation | 30 | 2015-6-1-2015-6-30 |
| 土壤热通量 Soil heat flux | |||||
| 土壤温度 Soil temperature | |||||
| 土壤水分 Soil moisture |
表1 观测站点信息
Table 1 The information of observation sites
站点名 Site name | 位置(经度/纬度/海拔) Location (longitude/ latitude/altitude) | 下垫面 Underlying surface | 观测项目 Observation item | 时间分辨率Temporal resolution (min) | 观测无效时段 Observation invalid period (年-月-日Year-month-day) |
|---|---|---|---|---|---|
大沙龙站 Dashalong station (DSL) | 98.9406° E 38.8399° N 3739 m | 沼泽类 Swamp | 降水量 Precipitation | 10 | 2015-9-13 |
| 土壤热通量 Soil heat flux | |||||
| 土壤温度 Soil temperature | |||||
| 土壤水分 Soil moisture | |||||
阿柔站 Arou station (AR) | 100.4643° E 38.0473° N 3033 m | 高寒草甸类 Alpine meadow | 降水量 Precipitation | 10 | 2015-7-31, 2015-8-4-2015-8-5, 2015-8-9-2015-8-16, 2015-8-18-2015-8-27, 2015-8-31-2015-9-20, 2015-9-30-2015-10-20 |
| 土壤热通量 Soil heat flux | |||||
| 土壤温度 Soil temperature | |||||
| 土壤水分 Soil moisture | |||||
峨堡站 Ebao station (EB) | 100.9151° E 37.9492° N 3294 m | 高寒草甸类 Alpine meadow | 降水量 Precipitation | 10 | 2015-11-1-2015-11-5 |
| 土壤热通量 Soil heat flux | |||||
| 土壤温度 Soil temperature | |||||
| 土壤水分 Soil moisture | |||||
景阳岭站 Jingyangling station (JYL) | 101.1160° E 37.8384° N 3750 m | 高寒草甸类 Alpine meadow | 降水量 Precipitation | 10 | |
| 土壤热通量 Soil heat flux | |||||
| 土壤温度 Soil temperature | |||||
| 土壤水分 Soil moisture | |||||
西大滩站 Xidatan station (XDT) | 94.1170° E 35.7170° N 4538 m | 高寒草原类 Alpine grassland | 降水量 Precipitation | 30 | |
| 土壤热通量 Soil heat flux | |||||
| 土壤温度 Soil temperature | |||||
| 土壤含水量 Soil moisture content | |||||
| 向上长波辐射 Upward long wave radiation | |||||
| 向下长波辐射 Downward long wave radiation | |||||
唐古拉站 Tanggula station (TGL) | 91.9330° E 33.0670° N 5110 m | 高寒草甸类 Alpine meadow | 降水量 Precipitation | 30 | |
| 土壤热通量 Soil heat flux | |||||
| 土壤温度 Soil temperature | |||||
| 土壤含水量 Soil moisture content | |||||
| 向上长波辐射 Upward long wave radiation | |||||
| 向下长波辐射 Downward long wave radiation | |||||
垭口站 Yakou station (YK) | 100.2421° E 38.0142° N 4148 m | 高寒草甸类 Alpine meadow | 降水量 Precipitation | 30 | 2015-6-1-2015-6-30 |
| 土壤热通量 Soil heat flux | |||||
| 土壤温度 Soil temperature | |||||
| 土壤水分 Soil moisture |
数据集名称 Dataset name | 内容 Content | 时间分辨率Temporal resolution | 空间分辨率Spatial resolution | 来源网址 Source URL |
|---|---|---|---|---|
| 中国西部1 km全天候地表温度数据集1 km all-weather surface temperature data set in Western China | 地表温度Surface temperature | Daily | 1000 m | https://data.tpdc.ac.cn/zh-hans/ |
| MOD13Q1 | 归一化植被指数Normalized difference vegetation index (NDVI) 红光、近红外波段地表反射率 Surface reflectance in red and near infrared bands | 16 day | 250 m | https://ladsweb.modaps.eosdis.nasa.gov/ |
| MOD09GA | 1~7波段地表反射率1-7 band surface reflectance | Daily | 500 m | https://ladsweb.modaps.eosdis.nasa.gov/ |
| 中国区域地面气象要素驱动数据集China regional surface meteorological element driven data set | 向下短波辐射Downward short wave radiation 向下长波辐射Downward long wave radiation | 3-hour 3-hour | 0.1° 0.1° | https://www.tpdc.ac.cn/zh-hans/ |
表2 遥感数据信息
Table 2 The information of remote sensing data
数据集名称 Dataset name | 内容 Content | 时间分辨率Temporal resolution | 空间分辨率Spatial resolution | 来源网址 Source URL |
|---|---|---|---|---|
| 中国西部1 km全天候地表温度数据集1 km all-weather surface temperature data set in Western China | 地表温度Surface temperature | Daily | 1000 m | https://data.tpdc.ac.cn/zh-hans/ |
| MOD13Q1 | 归一化植被指数Normalized difference vegetation index (NDVI) 红光、近红外波段地表反射率 Surface reflectance in red and near infrared bands | 16 day | 250 m | https://ladsweb.modaps.eosdis.nasa.gov/ |
| MOD09GA | 1~7波段地表反射率1-7 band surface reflectance | Daily | 500 m | https://ladsweb.modaps.eosdis.nasa.gov/ |
| 中国区域地面气象要素驱动数据集China regional surface meteorological element driven data set | 向下短波辐射Downward short wave radiation 向下长波辐射Downward long wave radiation | 3-hour 3-hour | 0.1° 0.1° | https://www.tpdc.ac.cn/zh-hans/ |

图2 技术路线
Fig.2 Technology road

图3 唐古拉站2015年地表层土壤热通量(G0)与深度为5 cm的土壤热通量(G5)散点分布和年均日变化曲线
Fig.3 Scatter point distribution and annual mean diurnal variation curve of ground surface soil heat flux (G0) and soil heat flux (G5) with a depth of 5 cm at TGL station in 2015
| 站点名Site name | 线性关系式Linear relation | R2 |
|---|---|---|
| 大沙龙站 DSL station | G0=1.05G | 0.88 |
| 阿柔站 AR station | G0=0.98G | 0.55 |
| 峨堡站 EB station | G0=1.11G | 0.96 |
| 景阳岭站 JYL station | G0=1.17G | 0.84 |
| 西大滩站 XDT station | G0=1.05G | 0.94 |
| 唐古拉站 TGL station | G0=1.02G | 0.96 |
| 垭口站 YK station | G0=1.02G | 0.92 |
表3 各站点G0与G的线性关系
Table 3 The linear relationship between G0 and G of each site
| 站点名Site name | 线性关系式Linear relation | R2 |
|---|---|---|
| 大沙龙站 DSL station | G0=1.05G | 0.88 |
| 阿柔站 AR station | G0=0.98G | 0.55 |
| 峨堡站 EB station | G0=1.11G | 0.96 |
| 景阳岭站 JYL station | G0=1.17G | 0.84 |
| 西大滩站 XDT station | G0=1.05G | 0.94 |
| 唐古拉站 TGL station | G0=1.02G | 0.96 |
| 垭口站 YK station | G0=1.02G | 0.92 |

图4 Ma模型估算地表层土壤热通量(G0_Ma)与对应地表层土壤热通量单点计算值(G0_obs)的比较
Fig.4 Comparison between ground surface soil heat flux (G0_Ma) estimated by Ma model and corresponding surface soil heat flux single point calculated value (G0_obs)
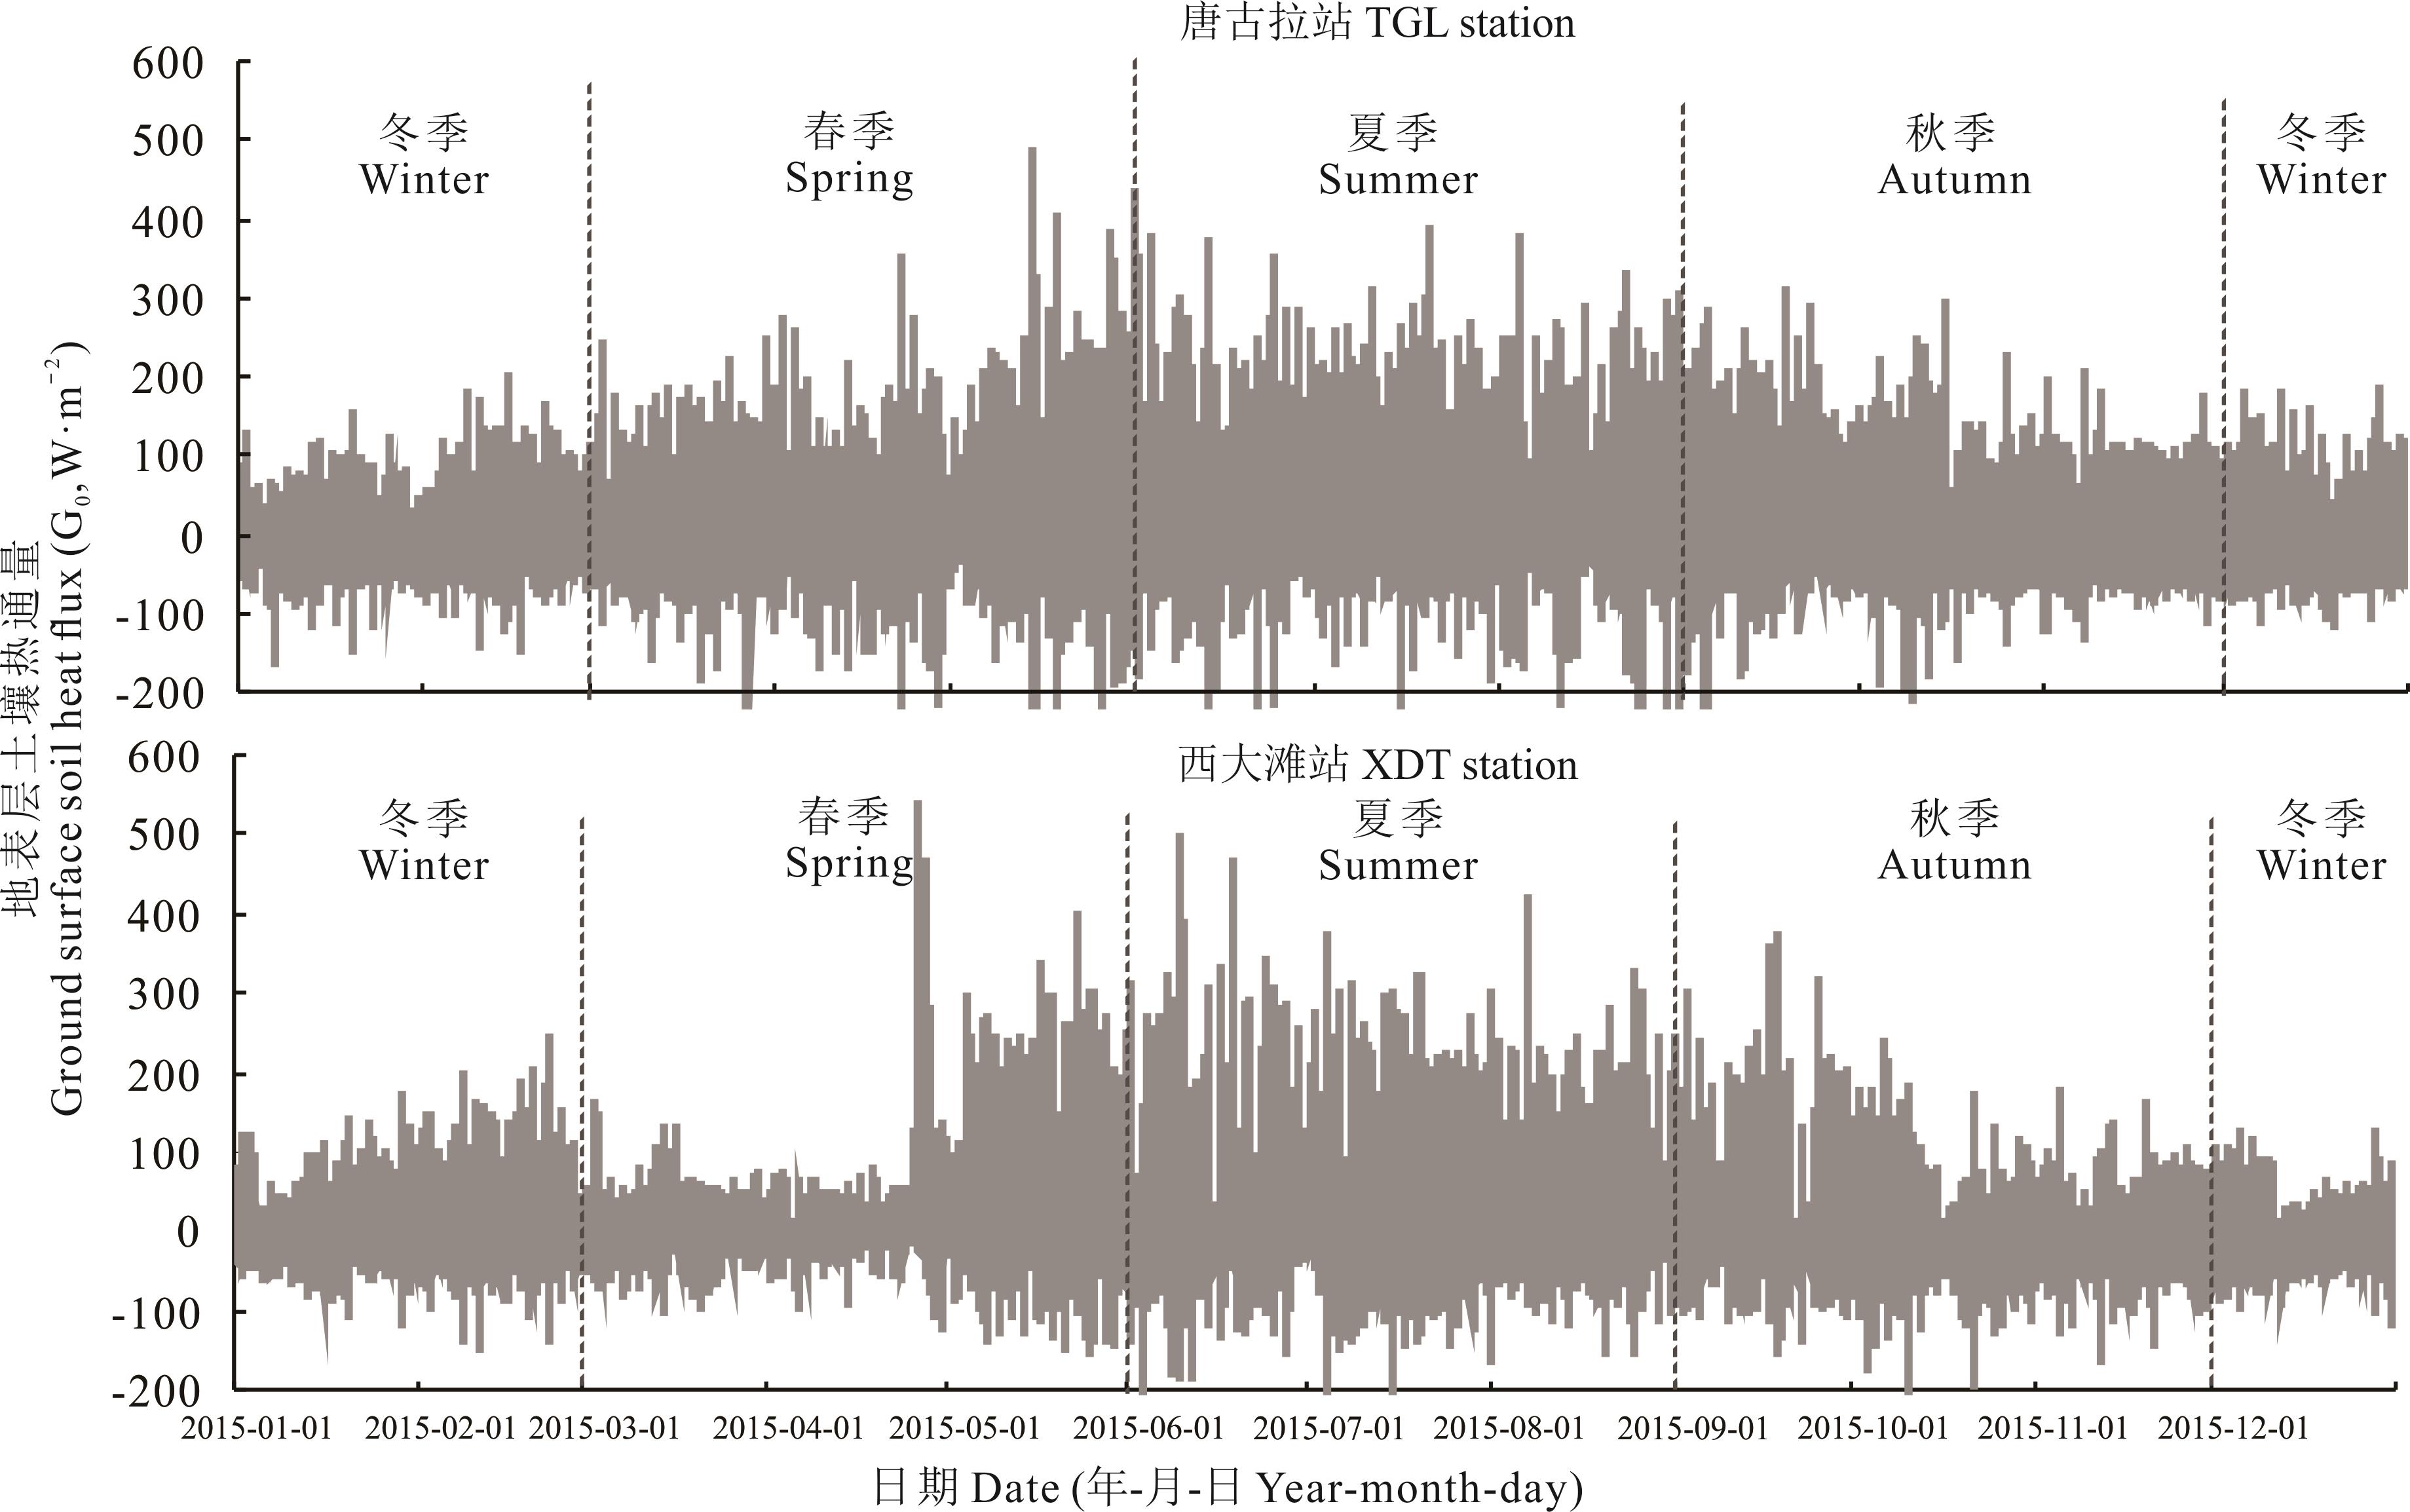
图5 唐古拉站、西大滩站地表层土壤热通量季节变化
Fig.5 Seasonal variation of soil heat flux in surface layer at TGL station and XDT station
站点 Station | 地表层土壤热通量Ground surface soil heat flux (G0,W·m-2) | ||||
|---|---|---|---|---|---|
| 春季Spring | 夏季Summer | 秋季Autumn | 冬季Winter | 年均值Average annual value | |
| 唐古拉站 TGL station | 4.840 | 11.240 | -5.740 | -10.270 | 0.690 |
| 西大滩站 XDT station | 9.650 | 2.470 | -4.550 | -8.640 | 2.810 |
| 峨堡站 EB station | 7.250 | 4.977 | -7.149 | -8.288 | -0.312 |
| 阿柔站 AR station | 2.030 | 3.870 | -1.557 | -1.533 | 1.468 |
| 大沙龙站DSL station | 1.338 | 5.541 | 1.057 | -9.621 | 1.558 |
| 景阳岭站 JYL station | 3.110 | 8.091 | -9.793 | -13.567 | -1.909 |
| 垭口站 YK station | 4.147 | 21.739 | -19.587 | -24.580 | -6.856 |
表4 各站点地表层土壤热通量的季节与年均值
Table 4 Seasonal and annual average values of ground surface soil heat flux in the surface layer of each station
站点 Station | 地表层土壤热通量Ground surface soil heat flux (G0,W·m-2) | ||||
|---|---|---|---|---|---|
| 春季Spring | 夏季Summer | 秋季Autumn | 冬季Winter | 年均值Average annual value | |
| 唐古拉站 TGL station | 4.840 | 11.240 | -5.740 | -10.270 | 0.690 |
| 西大滩站 XDT station | 9.650 | 2.470 | -4.550 | -8.640 | 2.810 |
| 峨堡站 EB station | 7.250 | 4.977 | -7.149 | -8.288 | -0.312 |
| 阿柔站 AR station | 2.030 | 3.870 | -1.557 | -1.533 | 1.468 |
| 大沙龙站DSL station | 1.338 | 5.541 | 1.057 | -9.621 | 1.558 |
| 景阳岭站 JYL station | 3.110 | 8.091 | -9.793 | -13.567 | -1.909 |
| 垭口站 YK station | 4.147 | 21.739 | -19.587 | -24.580 | -6.856 |

图6 2015年第113、193、289和353天地表层土壤热通量的空间分布
Fig.6 Spatial distribution of ground surface soil heat flux on days 113, 193, 289 and 353 in 2015
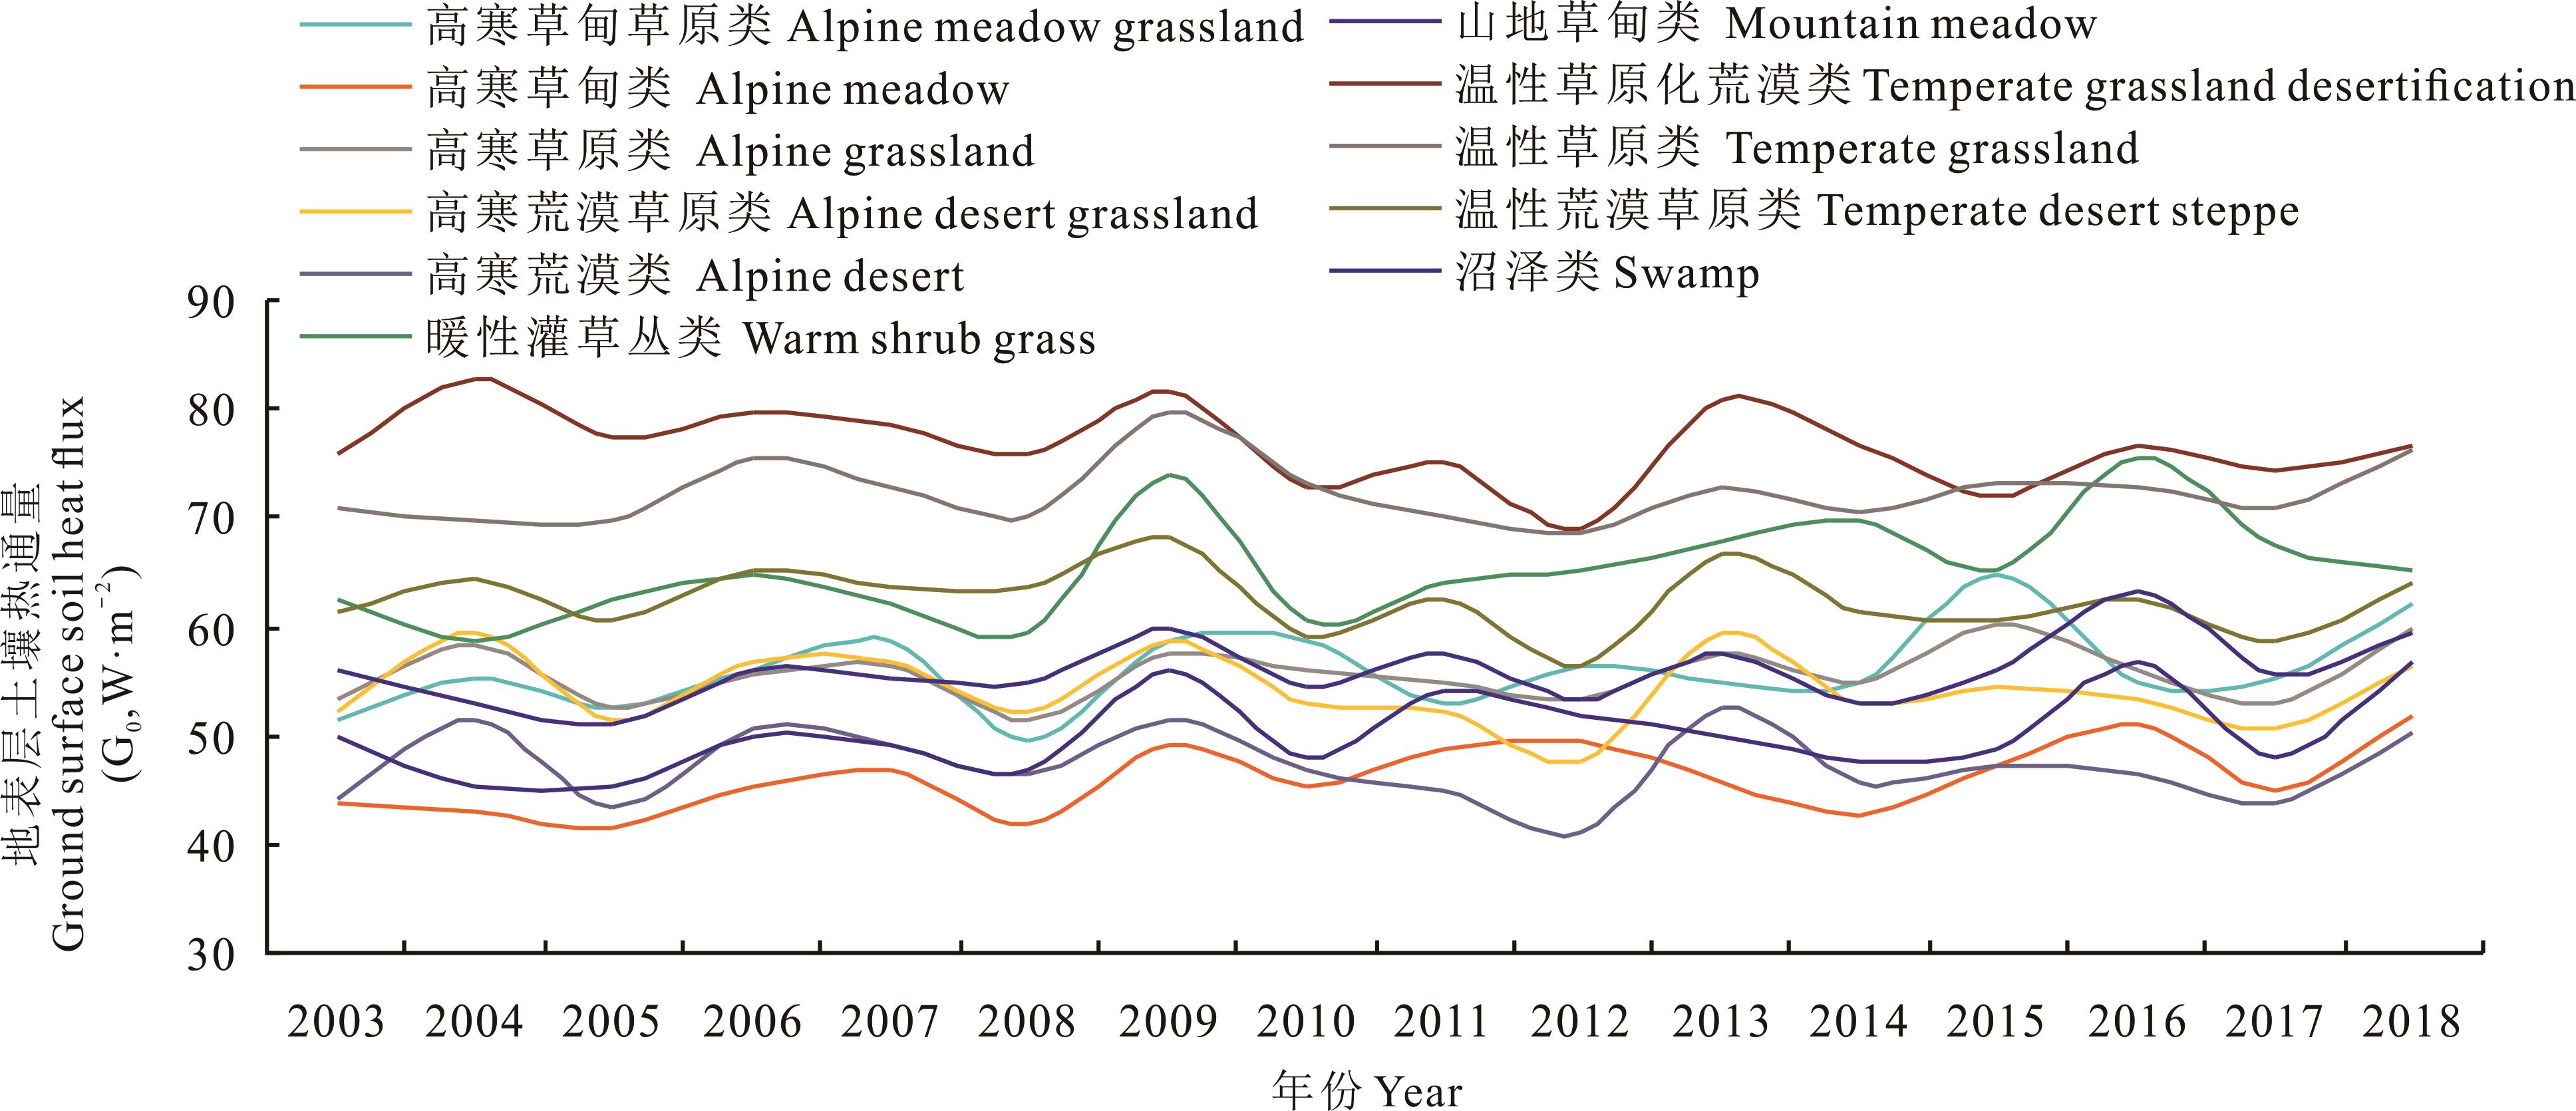
图7 不同草地类型2003-2018年G0均值变化
Fig. 7 Variation of G0 mean value of different grassland types from 2003 to 2018

图8 不同草地类型G0的年内变化
Fig. 8 Annual variation of G0 in different grassland types

图9 4类草地类型地表层土壤热通量的空间分布
Fig.9 Spatial distribution of ground surface soil heat flux of four grassland types

图10 不同草地类型的G0季节变化Ⅰ:高寒草甸类Alpine meadow;Ⅱ:高寒草原类Alpine grassland;Ⅲ:高寒荒漠草原类Alpine desert grassland;Ⅳ:高寒草甸草原类Alpine meadow grassland;Ⅴ:高寒荒漠类Alpine desert;Ⅵ:温性草原类Temperate grassland;Ⅶ:温性荒漠草原类Temperate desert steppe;Ⅷ:温性草原化荒漠类Temperate grassland desertification;Ⅸ:沼泽类Swamp;Ⅹ:暖性灌草丛类Warm shrub grass;Ⅺ:山地草甸类Mountain meadow.
Fig.10 Seasonal variation of G0 in different grassland types
| 1 | Tang Y H, Wan S Q, He J S, et al. Foreword to the special issue: looking into the impacts of global warming from the roof of the world. Journal of Plant Ecology, 2009, 2(4): 169-171. |
| 2 | Guo X X, Wang K, Li L, et al. Surface energy exchanges and evapotranspiration of an alpine meadow on the Zoige Plateau. Chinese Journal of Agrometeorology, 2021, 42(8): 642-656. |
| 郭小璇, 王凯, 李磊, 等. 若尔盖高原高寒草甸地表能量交换和蒸散研究. 中国农业气象, 2021, 42(8): 642-656. | |
| 3 | Su Y R, Lv S H, Fan G Z. The characteristics analysis on the summer atmospheric boundary layer height and surface heat fluxes over the Qinghai-Tibetan Plateau. Plateau Meteorology, 2018, 37(6): 1470-1485. |
| 苏彦入, 吕世华, 范广洲. 青藏高原夏季大气边界层高度与地表能量输送变化特征分析. 高原气象, 2018, 37(6): 1470-1485. | |
| 4 | Chen X L, Liu Y M, Wu G X. Understanding the surface temperature cold bias in CMIP5 AGCMs over the Tibetan Plateau. Advances in Atmospheric Sciences, 2017, 34(12): 1447-1460. |
| 5 | de Andrade B C C, Pedrollo O C, Ruhoff A, et al. Artificial neural network model of soil heat flux over multiple land covers in South America. Remote Sensing, 2021, 13(12): 2337. |
| 6 | Yang Q D, Zuo H C, Yang Y, et al. On the effect of the near-surface layer energy closure degree on land surface process simulations. Chinese Journal of Geophysics, 2012, 55(9): 2876-2888. |
| 杨启东, 左洪超, 杨扬, 等. 近地层能量闭合度对陆面过程模式影响. 地球物理学报, 2012, 55(9): 2876-2888. | |
| 7 | Hu H C, Li N N, Tian F Q, et al. Modification of harmonic analysis model for diurnal surface soil heat flux estimate from multiple remote sensing data. Journal of Applied Remote Sensing, 2018, 12(3): 1-19. |
| 8 | Xiao Y, Zhao L, Li R, et al. Seasonal variation characteristics of energy budget components in permafrost regions of Northern Tibetan Plateau. Journal of Glaciology and Geocryology, 2011, 33(5): 1033-1039. |
| 肖瑶, 赵林, 李韧, 等.青藏高原腹地高原多年冻土区能量收支各分量的季节变化特征. 冰川冻土, 2011, 33(5): 1033-1039. | |
| 9 | Zhong L, Ma Y M, Ma W Q, et al. Land surface heat fluxes in the Middle Reaches of Yarlung Zangbo River and its two tributaries derived from AVHRR and MODIS data. Journal of Glaciology and Geocryology, 2011, 33(2): 309-317. |
| 仲雷, 马耀明, 马伟强, 等. 西藏中部“一江两河”地区地表通量的卫星遥感估算. 冰川冻土, 2011, 33(2): 309-317. | |
| 10 | Liu Y. National grassland monitoring report in 2016. China Animal Husbandry, 2017(8): 18-35. |
| 刘源. 2016年全国草原监测报告. 中国畜牧业, 2017(8): 18-35. | |
| 11 | Wu S N, Zhang X, Gao X X, et al. Succession dynamics of a plant community of degraded alpine meadow during the human-induced restoration process in the Three Rivers Source region. Acta Ecologica Sinica, 2019, 39(7): 2444-2453. |
| 武胜男, 张曦, 高晓霞, 等. 三江源区“黑土滩”型退化草地人工恢复植物群落的演替动态. 生态学报, 2019, 39(7): 2444-2453. | |
| 12 | Choudhury B J, Idso S B, Reginato R J. Analysis of an empirical model for soil heat flux under a growing wheat crop for estimating evaporation by an infrared-temperature based energy balance equation. Agricultural and Forest Meteorology, 1987, 39(4): 283-297. |
| 13 | Bastiaanssen W. SEBAL-based sensible and latent heat fluxes in the irrigated Gediz Basin, Turkey. Journal of Hydrology, 2000, 229(1/2): 87-100. |
| 14 | Ma Y M, Ishikawa H, Tsukamoto O, et al. Regionalization of surface fluxes over heterogeneous landscape of the Tibetan Plateau by using satellite remote sensing data. Journal of the Meteorological Society of Japan, 2003, 81(2): 277-293. |
| 15 | Yang C, Wu T H, Wang J M, et al. Estimating surface soil heat flux in permafrost regions using remote sensing-based models on the Northern Qinghai-Tibetan Plateau under clear-sky conditions. Remote Sensing, 2019, 11(4): 416. |
| 16 | Su D X. The compilation and study of the grassland resource map of China on the scale of 1∶1000000, 1996(1): 75-83. |
| 苏大学.1∶1000000中国草地资源图的编制与研究. 自然资源学报, 1996(1): 75-83. | |
| 17 | Liu S M, Xu Z W, Wang W Z, et al. A comparison of eddy-covariance and large aperture scintillometer measurements with respect to the energy balance closure problem. Hydrology and Earth System Sciences, 2011, 15(4): 1291-1306. |
| 18 | Li X, Cheng G D, Liu S M, et al. Heihe watershed allied telemetry experimental research (HiWATER): Scientific objectives and experimental design. Bulletin of the American Meteorological Society, 2013, 94(8): 1145-1160. |
| 19 | Xiao Y. Meteorological data set of permafrost in Xidatan, Qinghai-Tibet Plateau, 2014-2016. Lanzhou: National Cryosphere Desert Data Center, 2020. |
| 肖瑶. 2014-2016年青藏高原西大滩冻土气象数据集. 兰州: 国家冰川冻土沙漠科学数据中心, 2020. | |
| 20 | Xiao Y. Meteorological dataset of Tanggula permafrost on Qinghai-Tibet Plateau from 2014 to 2016. Lanzhou: National Cryosphere Desert Data Center, 2020. |
| 肖瑶. 2014-2016年青藏高原唐古拉冻土气象数据集. 兰州: 国家冰川冻土沙漠科学数据中心, 2020. | |
| 21 | Yang C, Wu T H, Yao J M, et al. An assessment of using remote sensing-based models to estimate ground surface soil heat flux on the Tibetan Plateau during the freeze-thaw process. Remote Sensing, 2020, 12(3): 501. |
| 22 | Zhang X D, Zhou J, Göttsche F M, et al. A method based on temporal component decomposition for estimating 1-km all-weather land surface temperature by merging satellite thermal infrared and passive microwave observations. IEEE Transactions on Geoscience and Remote Sensing, 2019, 57(7): 4670-4691. |
| 23 | He J, Yang K, Tang W J, et al. The first high-resolution meteorological forcing dataset for land process studies over China. Scientific Data, 2020, 7(1): 25. |
| 24 | Yang K, Jie H, Tang W J, et al. On downward shortwave and longwave radiations over high altitude regions: Observation and modeling in the Tibetan Plateau. Agricultural and Forest Meteorology, 2009, 150(1): 38-46. |
| 25 | Yang K, He J. China regional surface meteorological element driven data set (1979-2018). Beijing: National Tibetan Plateau Data Center, 2019. |
| 阳坤, 何杰. 中国区域地面气象要素驱动数据集(1979-2018). 北京: 国家青藏高原科学数据中心, 2019. | |
| 26 | Yang K, He J. China meteorological forcing dataset (1979-2018). Beijing: National Tibetan Plateau Data Center, 2019. |
| 阳坤, 何杰. 中国气象强迫数据集(1979-2018). 北京: 国家青藏高原科学数据中心, 2019. | |
| 27 | Yang K, Wang J M. A temperature prediction-correction method for estimating surface soil heat flux from soil temperature and moisture data. Science in China Series D: Earth Sciences, 2008, 51(5): 721-729. |
| 28 | Wu Y Y, Wen J, Wang Z L, et al. The characteristics of land-atmospheric water and heat exchange during soil freezing-thawing process over the underlying surface of the alpine grassland in the source region of the yellow river. Plateau Meteorology, 2022, 41(1): 132-142. |
| 武月月, 文军, 王作亮, 等. 黄河源高寒草原下垫面土壤冻融过程中陆-气间的水热交换特征分析. 高原气象, 2022, 41(1): 132-142. | |
| 29 | Yao J M, Zhao L, Gu L L, et al. The surface energy budget in the permafrost region of the Tibetan Plateau. Atmospheric Research, 2011, 102(4): 394-407. |
| 30 | Tanaka K, Tamagawa I, Ishikawa H, et al. Surface energy budget and closure of the eastern Tibetan Plateau during the GAME-Tibet IOP 1998. Journal of Hydrology, 2003, 283(1/2/3/4): 169-183. |
| 31 | Osterkamp T E. Freezing and thawing of soils and permafrost containing unfrozen water or brine. Water Resources Research, 1987, 23(12): 2279-2285. |
| 32 | Li G W, Wen J, Wang X, et al. Analysis of the characteristics of soil heat flux in the freezing process of alpine wetland at Maduo station. Chinese Journal of Atmospheric Sciences, 2019, 43(4): 719-729. |
| 李光伟, 文军, 王欣, 等. 麻多高寒湿地冻结过程中土壤热通量变化特征分析. 大气科学, 2019, 43(4): 719-729. | |
| 33 | Su Z. The Surface Energy Balance System (SEBS) for estimation of turbulent heat fluxes. Hydrology and Earth System Sciences, 2002, 6(1): 85-100. |
| 34 | Liang S L. Narrowband to broadband conversions of land surface albedo I: Algorithms. Remote Sensing of Environment, 2001, 76(2): 213-238. |
| 35 | Qi J, Chehbouni A, Huete A R, et al. A modified soil adjusted vegetation index. Remote Sensing of Environment, 1994, 48(2): 119-126. |
| 36 | Amatya P M, Ma Y M, Han C B, et al. Recent trends (2003-2013) of land surface heat fluxes on the southern side of the central Himalays, Nepal. Journal of Geophysical Research: Atmospheres, 2015, 120(23): 11957-11970. |
| 37 | Qin Z H, Li W J, Xu B, et al. The estimation of land surface emissivity for Landsat TM6. Remote Sensing for Land & Resources, 2004, 16(3): 28-32, 36, 41. |
| 覃志豪, 李文娟, 徐斌, 等. 陆地卫星TM6波段范围内地表比辐射率的估计. 国土资源遥感, 2004, 16(3): 28-32, 36, 41. | |
| 38 | Li M C, Luo T X, Guo J, et al. Soil heat flux in abies george virgin forest at the alpine timberline, southeastern Tibetan Plateau. Mountain Research, 2008(4): 490-495. |
| 李明财, 罗天祥, 郭军, 等. 藏东南高山林线冷杉原始林土壤热通量. 山地学报, 2008(4): 490-495. | |
| 39 | Wu T H, Zhao L, Li R, et al. Recent ground surface warming and its effects on permafrost on the central Qinghai-Tibet Plateau. International Journal of Climatology, 2013, 33: 920-930. |
| 40 | Hao Y J, Deng Q L, Wang Y X, et al. Dynamic characteristics of soil heat flux and their relationships with meteorological factors in the valley-type savanna of Yuanjiang of southwest China. Journal of Northwest Forestry University, 2019, 34(5): 23-28. |
| 郝雅婕, 邓巧玲, 王艳霞, 等. 元江干热河谷稀树灌丛土壤热通量特征. 西北林学院学报, 2019, 34(5): 23-28. | |
| 41 | Ji G L. The characteristics of transparency of atmosphere on the main part of Qinghai-Xizang Plateau. Plateau Meteorology, 1985 (Supple 2): 122-129. |
| 季国良. 青藏高原主体的大气透明度特征. 高原气象, 1985(增刊2): 122-129. | |
| 42 | He D Y, Tian H, Deng W T. Characteristics of seasonal surface temperature variation over the Tibetan Plateau. Journal of Nanjing University of Information Science & Technology (Natural Science Edition), 2014, 6(6): 558-569. |
| 何冬燕, 田红, 邓伟涛. 青藏高原不同季节地表温度变化特征分析. 南京信息工程大学学报(自然科学版), 2014, 6(6): 558-569. | |
| 43 | Yang C, Wu T H, Yao J M, et al. Temporal and spatial characteristics of ground surface soil heat flux over the Qinghai-Tibetan Plateau. Plateau Meteorology, 2020, 39(4): 706-718. |
| 杨成, 吴通华, 姚济敏, 等. 青藏高原表层土壤热通量的时空分布特征. 高原气象, 2020, 39(4): 706-718. | |
| 44 | Liu J H, Gao J X, Wang W J. Variations of vegetation coverage and its relations to global climate changes on the Tibetan Plateau during 1981-2005. Mountain Research, 2013, 31(2): 234-242. |
| 刘军会, 高吉喜, 王文杰. 青藏高原植被覆盖变化及其与气候变化的关系. 山地学报, 2013, 31(2): 234-242. | |
| 45 | Li N N, Jia L, Lu J. An improved algorithm to estimate the surface soil heat flux over a heterogeneous surface: A case study in the Heihe River Basin. Scientia Sinica(Terrae), 2015, 45(4): 494-507. |
| 李娜娜, 贾立, 卢静. 复杂下垫面地表土壤热通量算法改进: 以黑河流域为例. 中国科学: 地球科学, 2015, 45(4): 494-507. | |
| 46 | Zhang F W, Li Y N, Zhao L, et al. Primary study on energy exchange and energy balance ratio in an alpine meadow of Kobersia humilis. Mountain Research, 2006, 24(B10): 258-265. |
| 张法伟, 李英年, 赵亮, 等. 高寒矮嵩(Kobersia humilis)草甸能量平衡和闭合状况的初步研究. 山地学报, 2006, 24(B10): 258-265. |
| [1] | 修炀景, 侯蒙京, 田骄阳, 梁天刚, 冯琦胜. 基于土地利用/覆盖的甘肃省景观生态风险时空变化特征[J]. 草业学报, 2023, 32(1): 1-15. |
| [2] | 王瑞泾, 冯琦胜, 金哲人, 刘洁, 赵玉婷, 葛静, 梁天刚. 青藏高原退化草地的恢复潜势研究[J]. 草业学报, 2022, 31(6): 11-22. |
| [3] | 李洋, 王毅, 韩国栋, 孙建, 汪亚峰. 青藏高原高寒草地土壤微生物量碳氮含量特征及其控制要素[J]. 草业学报, 2022, 31(6): 50-60. |
| [4] | 蔺豆豆, 琚泽亮, 柴继宽, 赵桂琴. 青藏高原燕麦附着耐低温乳酸菌的筛选与鉴定[J]. 草业学报, 2022, 31(5): 103-114. |
| [5] | 金哲人, 冯琦胜, 王瑞泾, 梁天刚. 基于MODIS数据与机器学习的青藏高原草地地上生物量研究[J]. 草业学报, 2022, 31(10): 1-17. |
| [6] | 张仁平, 郭靖, 马晓芳, 郭伟勇. 基于MODIS数据的新疆草地物候提取方法及变化趋势分析[J]. 草业学报, 2022, 31(1): 1-12. |
| [7] | 付刚, 王俊皓, 李少伟, 何萍. 藏北高寒草地牧草营养品质对放牧的响应机制[J]. 草业学报, 2021, 30(9): 38-50. |
| [8] | 南志标, 王彦荣, 聂斌, 李春杰, 张卫国, 夏超. 春箭筈豌豆新品种“兰箭3号”选育与特性评价[J]. 草业学报, 2021, 30(4): 111-120. |
| [9] | 吴瑞, 刘文辉, 张永超, 秦燕, 魏小星, 刘敏洁. 青藏高原老芒麦落粒性及农艺性状相关性研究[J]. 草业学报, 2021, 30(4): 130-139. |
| [10] | 赵文, 尹亚丽, 李世雄, 刘燕, 刘晶晶, 董怡玲, 苏世锋, 吉凌鹤. 祁连山不同类型草地土壤细菌群落特征研究[J]. 草业学报, 2021, 30(12): 161-171. |
| [11] | 石明明, 王晓敏, 陈奇, 韩炳宏, 周秉荣, 肖建设, 肖宏斌. 高寒草地干湿生态系统土壤水分及入渗对降水的响应[J]. 草业学报, 2021, 30(12): 49-58. |
| [12] | 崔博超, 郑江华, 吐尔逊·哈斯木, 段素素, 杜梦洁. 塔里木河流域草地净初级生产力时空分异特征研究[J]. 草业学报, 2020, 29(6): 1-13. |
| [13] | 邱月, 吴鹏飞, 魏雪. 三种人工草地小型土壤节肢动物群落多样性动态及其差异[J]. 草业学报, 2020, 29(5): 21-32. |
| [14] | 杨阳, 田莉华, 田浩琦, 孙怀恩, 赵景学, 周青平. 增温对川西北高寒草甸草场植物凋落物分解的影响[J]. 草业学报, 2020, 29(10): 35-46. |
| [15] | 普雪可, 吴春花, 周永瑾, 勉有明, 苗芳芳, 侯贤清, 李荣. 宁南旱区地膜秸秆沟垄双覆盖对土壤水分时空变化及马铃薯产量的影响[J]. 草业学报, 2020, 29(10): 149-160. |
| 阅读次数 | ||||||
|
全文 |
|
|||||
|
摘要 |
|
|||||